• +1 (312) 549-9986

Gold $2,731.68 $11.11 0.41% Silver $34.18 $0.39 1.15% Platinum $1,020.98 $14.67 1.46% Palladium $1,074.60 $18.31 1.73%
RSS

Blog posts tagged with 'fomc'

Zaner Daily Precious Metals Commentary
Wednesday, September 18, 2024

9/18/2024

Gold and silver await Fed decision

OUTSIDE MARKET DEVELOPMENTS
: Fed funds futures continue to suggest a 50 bps cut when the Fed announces policy this afternoon. That bias seems to ignore the central bank's "data dependency" mantra. Recent data have reflected an economy that remains resilient and therefore warrants a more conservative 25 bps cut.

The policy statement, economic projections, and Powell's presser will be closely scrutinized for clues as to the likely rate path moving forward. The market continues to price in 100 bps in cuts by year-end, implying that at least one of the three remaining FOMC meetings will end with a 50 bps cut. I just don't think it will be this one.

Former St. Louis Fed President Bullard agrees. He said the case for a half-point Fed rate cut is "overblown" in a CNBC interview this morning.

UK CPI held steady at 2.2% y/y in August. However, core CPI accelerated to 3.6% y/y from 3.3% in July on the back of rising services prices. The BoE was already expected to hold steady on rates tomorrow and the inflation data seals the deal.

The BoE made its initial rate cut in August on a controversial 5-4 vote. The rebound in inflation suggests the decision may have been premature. I'm sure this will be mentioned in the board room of the Eccles Building today.

ECB Governing Council Member and Bundesbank President Joachim Nagel urged patients on inflation, noting that services inflation in particular remains "alarmingly high." Nagel warned that borrowing costs "will certainly not go down as quickly and sharply as they went up." While this hints at an ECB hold in October, recent ECBSpeak has been mixed.

U.S. mortgage applications jumped 14.2% in the week ended 13-Sep as 30-year mortgage rates dropped to a 23-month low of 6.15%. While the purchase index rose 5.4%, high rates remain a headwind for the housing market.

U.S. housing starts rose 9.6% to 1.356M in August, above expectations of 1.311M, versus 1.237M in July. That's the best print since April as a strong 15.8% surge in single-family starts offset a 4.2% decline in multi-family starts. Completions increased by 9.2% to 1.788M.

Reports of a potential explosive device near a Trump rally on Long Island further amplifies political tensions in the U.S. This is a developing story.  


GOLD

OVERNIGHT CHANGE THROUGH 6:00 AM CDT: +$6.36 (+0.25%)
5-Day Change: +$58.33 (+2.32%)
YTD Range: $1,986.16 - $2,589.13
52-Week Range: $1,812.39 - $2,589.13
Weighted Alpha: +34.76

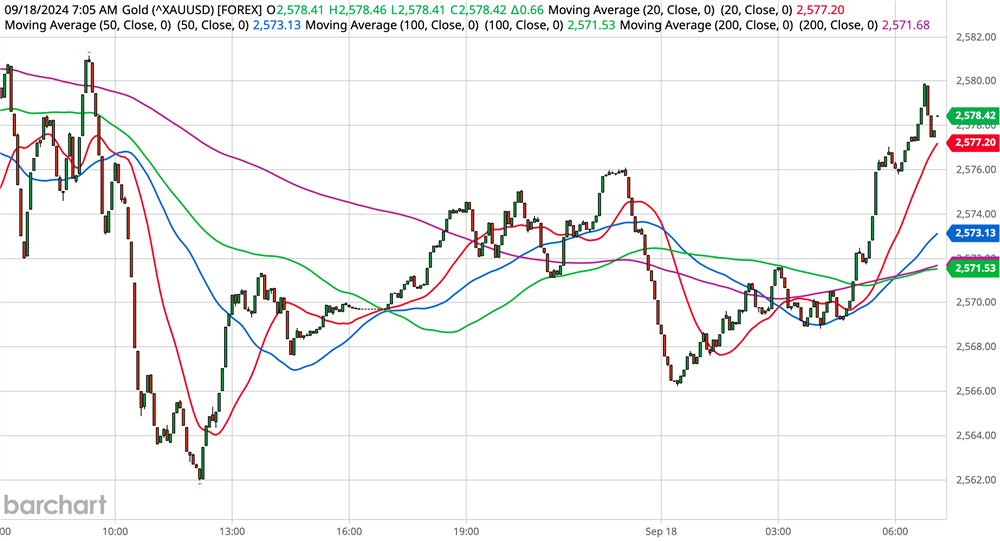
Gold is narrowly confined within yesterday's range as the trade eagerly awaits today's Fed decision. A cautious 25 bps cut could initially lead to corrective action, but regardless of the size, the Fed's first rate cut in more than four years is a generally bullish event for the yellow metal.


Even if the Fed goes aggressive and cuts by a half-point it would imply smaller cuts in November and December. This may lead to the "sell the fact" event I've warned about in previous commentary this week.

The guidance provided in the statement, the dots, and Powell's presser will set expectations for the two remaining FOMC meetings this year, and into Q1'25.

Downticks on Tuesday were successfully contained by support at $2,559.79/$2,557.21. This level is reinforced by yesterday's low at $2,561.96. Secondary support is noted at $2,529.57/$2,525.52. The 20-day moving average has provided good support on a close basis for more than a month and comes in at $2,523.13.

If gold sells off on the Fed's decision, it may take a dip below $2,500 to entice renewed buying interest. Solid chart support at $2,474.31/08 is bolstered by the 50-day moving average at $2,469.80.

On the upside, fresh record highs above $2,589.13 would clear the way for attainment of the $2,597.15/$2,600.00 objective. A secondary target is marked by Fibonacci resistance at $2,619.35. New highs would also intensify speculation about an eventual move toward $3,000.


SILVER

OVERNIGHT CHANGE THROUGH 6:00 AM CDT: -$0.095 (-0.31%)
5-Day Change: +$1.773 (+6.18%)
YTD Range: $21.945 - $32.379
52-Week Range: $20.704 - $32.379
Weighted Alpha: +31.39

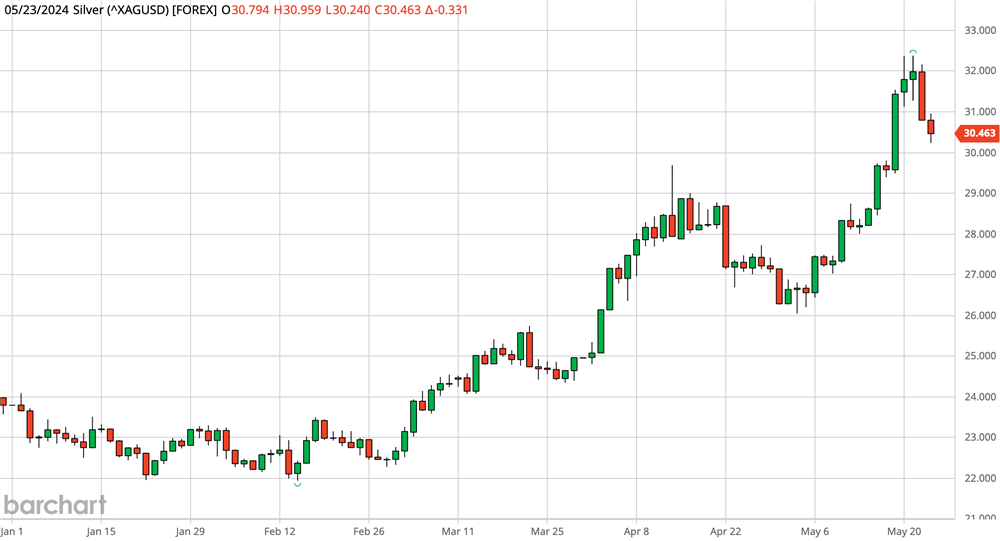
Silver has slipped to new lows for the week as traders are perhaps a little less inclined to go long into the FOMC statement. A softer tone in gold and a slightly better dollar weigh.


A retreat below $30 must be considered if the Fed cuts by just a quarter-point. However, such a move would suggest potential for a retreat to the $29 zone where the important moving averages are clustered.

On the other hand, penetration of resistance at $30.963/$31.073 would keep the white metal on track for a challenge of the $31.652 high from 11-Jul. Above the latter, the high for the year at $32.379 (21-May) would attract.

Peter A. Grant
Vice President, Senior Metals Strategist
Zaner Metals LLC
Tornado Precious Metals Solutions by Zaner
312-549-9986 Direct/Text
[email protected]
www.ZanerPreciousMetals.com
www.TornadoBullion.com
X: @GrantOnGold
X: @ZanerMetals
Facebook: @ZanerPreciousMetals

Non-Reliance and Risk Disclosure: The opinions expressed here are for general information purposes only and should not be construed as trade recommendations, nor a solicitation of an offer to buy or sell any precious metals product. The material presented is based on information that we consider reliable, but we do not represent that it is accurate, complete, and/or up-to-date, and it should not be relied on as such. Opinions expressed are current as of the time of posting and only represent the views of the author and not those of Zaner Metals LLC unless otherwise expressly noted.

Morning Metals Call
Wednesday, September 18, 2024
Good morning. The precious metals are mostly lower in early U.S. trading.
 
Gold Chart
 
U.S. calendar features Mortgage Applications, Housing Starts, EIA Data, TIC Data.
 
FOMC policy announcement, economic projections, Powell presser.
Fed holds steady, but dots tilt hawkish
Wednesday, June 12, 2024
The Fed held steady on rates in line with expectations. However, the dots have tilted more hawkish, projecting just a single rate cut this year, versus three in March.
 
Powell presser starts at the bottom of the hour.
 
Gold and silver have retreated into the intraday range.
Morning Metals Call
Wednesday, June 12, 2024
Good morning. The precious metals are mostly lower in early U.S. trading.
 
 
U.S. calendar features CPI (+0.1% expected), EIA Data, Treasury Budget, FOMC Policy Statement (steady expected), Economic Projections, Powell Presser.
Morning Metals Call
Tuesday, June 11, 2024

Good morning. The precious metals are lower in early U.S. trading.

Gold Chart

U.S. calendar features NFIB Small Business Optimism Index, FOMC 2-Day meeting begins.

Hedging can protect holders of physical precious metals inventory from adverse market moves
Thursday, May 23, 2024

Gold has plunged more than 4% from Monday's record high at $2449.34. The yellow metal fell $42.57 on Wednesday and is off another $35 today.

Gold Chart 

Silver has tumbled nearly 7% from Tuesday's 11-year high at $32.38!

Silver Chart

Losses are mounting as markets unwind rate cut expectations in the wake of Wednesday's release of the minutes from the last FOMC meeting.

Short-term losses like this can have a significant detrimental impact on bullion dealers, mints, and refiners that hold physical precious metals inventory.

The Tornado Hedging Platform by Zaner allows our clients to protect their inventory against such adverse market movements.

"As a precious metals dealer that holds a decent amount of physical inventory, if I am not hedged, on big down days in precious metals, I could lose a whole month in profits." – Tornado Hedging Client

Please visit www.TornadoBullion.com for more information.

Grant on Gold – September 25, 2023
Monday, September 25, 2023

Gold continues to consolidate in the bearish channel that dominated throughout the summer. The 100-day MA successfully contained the upside last week, leaving the downside vulnerable to further tests.

Spot Gold Daily Chart through 9/25/2023

Last week the Fed held steady on rates, as was widely expected. However, Chairman Powell noted strength in the economy and his desire to see “convincing evidence” that inflation is moderating.

The dot plot suggested that at least one more rate hike could be seen this year. Perhaps more importantly, the dots reinforced the ‘higher for longer’ scenario with the first rate cut now forecast for June 2024.

The 10-year yield moved more convincingly above 4% on Monday, reaching levels not seen since 2007. Higher yields are buoying the greenback. The dollar index extended on Monday to reach 10-month highs.

Higher yields and a higher dollar will continue to pose a considerable headwind for gold. Mounting global growth risks apply additional weight.

It is believed that the Eurozone economy contracted in Q3, even as inflation remains elevated. September CPI is forecast to be 4.5%. While that’s down from 5.2% in August, the inflation rate remains well above target.

Earlier in the month, the ECB hiked rates for a 10th consecutive meeting, pushing the deposit rate to a record high of 4%. Analysts now believe the ECB is on hold, probably into next summer.

However, the ECB also will want to see some convincing evidence to confirm that inflation has been squelched in the EU. Until that happens, at least one more rate hike can’t be ruled out.

Of course, worries about the Chinese economy persist as well. This could have grim implications for the global economy.

Chinese demand for imports has contracted in nine of the last 10 months. If China slips into recession, there are concerns that demand for commodities will suffer further. While that may help tamp inflation, the demand destruction will be the greater concern in the medium term.

The ongoing expansion of official gold reserves remains a bright spot for the yellow metal. Central banks continue to seek diversification, mainly out of dollars and into gold.

While central bank gold demand slowed in Q2, the record purchases in Q1 led to record H1 demand of 387 tonnes. Turkey was a big seller in April and May before resuming purchases in June.

The World Gold Council believes the Turkish sales were “tactical rather than strategic” amid internal economic and political strife. Interestingly, as the TCMB was selling, demand for bars, coins, and gold jewelry surged in the country as citizens sought to protect their wealth against a devaluing lira.

Estimated World Official Gold Reserves

Taking into consideration estimates of China’s unreported gold reserves, analyst Jan Nieuwenhuijs of Gainesville Coins believes world reserves reached an all-time high of 38,764 tonnes in Q2. If that’s an accurate assessment, it exceeds the previous record of 39,347 tonnes from 1965.

Nieuwenhuijs points out that gold as a percentage of total global reserves currently stands at 17%, while the long-term historical average is 58%. That suggests there remains considerable potential for further central bank gold buying.

If gold were once again to make up the majority of global reserves, one of Jan’s models projects a price in excess of $8,000 over the next 10 years.

Silver

Silver continues to trade in a choppy manner within the confines of a large symmetrical triangle pattern. The white metal rose more than 2% last week, but most of those gains were given back on Monday.

Spot Silver Daily Chart through 9/25/2023

The silver market is facing some of the same headwinds as the gold market. Perhaps most notably, sluggish demand for electronics in China is likely to adversely impact demand for silver.

The Chinese auto sector returned to growth in August, after contracting in June and July. Sales surged 8.5% m/m and 2.2% y/y with electric vehicles such as Teslas increasingly popular. However, the sustainability of these gains is in doubt as China’s real estate crisis threatens to sap consumer demand.

Real estate is the biggest contributor to Chinese GDP, so the crisis has the potential to drag the middle kingdom into recession. Growth risks in the world’s second-largest economy pose considerable risks to the global economy as a whole.

That being said, the global trend toward electrification keeps the long-term supply/demand fundamentals undeniably positive. Therefore, retreats into the range that has emerged this year are still likely to be viewed as buying opportunities.

Initial support is well-defined by the series of lows at $22.30, $22.22, and $22.11. This zone should keep the low for the year at $19.90 (10-Mar) at bay.

Last week’s high at $23.78 is now seen as the trigger for a retest of the upper reaches of the triangle pattern, which comes in around $24.50.

PGMs

Platinum continues to struggle on upticks. The market rose modestly last week, notching a second consecutive higher weekly close. However, renewed selling pressure surfaced on Monday.

Spot Platinum Daily Chart through 9/25/2023

While U.S. auto sales were robust in August, global growth concerns continue to percolate below the surface. Rising interest rates also threaten to undermine consumer purchasing power.

Late-summer sales were helped by better supply, but if the expanding UAW strike persists the supply of new cars will tighten.   

Palladium remains defensive at the low end of the multi-year range.


Non-Reliance and Risk Disclosure: The opinions expressed here are for general information purposes only and should not be construed as trade recommendations, nor a solicitation of an offer to buy or sell any precious metals product. The material presented is based on information that we consider reliable, but we do not represent that it is accurate, complete, and/or up-to-date, and it should not be relied on as such. Opinions expressed are current as of the time of posting and only represent the views of the author and not those of Zaner Metals LLC unless otherwise expressly noted.

Grant on Gold – August 7, 2023
Monday, August 7, 2023

Gold is maintaining a corrective to consolidative tone in the wake of the July FOMC meeting. The market now looks to this week’s inflation data for further confirmation that the Fed is on hold.

Spot Gold Daily Chart through 8/7/2023

July CPI comes on Thursday and median expectations are for a 0.2% monthly increase. PPI is out on Friday and the market is expecting a 0.2% increase here as well.

While decent U.S. economic data suggests there is conceivably room for further monetary tightening, Fed funds futures show an 85% probability that the FOMC will hold steady when they next meet in September. That conviction is not as strong into year-end.

There is heightened optimism in recent weeks that the Fed is going to successfully negotiate a soft landing. It would be quite a feat to avoid recession on the heels of 11 consecutive interest rate hikes over the past 16 months.

The DJIA has rebounded to 16-month highs in recent weeks and is a mere 4% off its all-time high as investors are lured back into stocks. This appetite for risk has weighed on gold with Friday marking the tenth consecutive day of outflows from ETFs, leaving holdings down 2.86 Moz year-to-date.

Is there another shoe to drop in the form of a second wave of inflation and/or a rebound in growth risks? Time will tell, but energy prices are already back on the rise. Crude oil has risen nearly 20% in the past 6-weeks.

Demand from China and India remains subdued, with the former still struggling to recover from COVID-related lockdowns and the latter facing record-high prices against the rupee.

The Indian monsoon season began late this year, but crops have been damaged by more recent torrential rains. A ban on some rice exports from India, meant to ensure domestic availability, is likely to contribute to global food-price inflation while simultaneously putting further pressure on gold demand.

Friday’s price action resulted in a key reversal (lower low, close above the previous session’s high). That’s generally a pretty favorable technical chart pattern, but upside follow-through failed to materialize on Monday. Nonetheless, Friday’s low at 1924.78 now provides a good intervening barrier ahead of the more important $1893.07 support level (29-Jun low).

A breach of initial resistance at $1947 would bode well for renewed tests above the 100-day SMA at $1968.14. I see the July high at $1987.53 as the trigger for a run back above $2000 and an eventual challenge of the all-time high at $2075.28.

However, this bullish scenario threatens to get derailed by weakness in the silver market.

Silver

Silver remains on the defensive weighed by ongoing concerns about the Chinese economy. The white metal notched a third consecutive lower weekly close last week and extended 2% lower on Monday.

Spot Silver Daily Chart through 8/7/2023

An ascendant China and its growing middle class have been at the core of every long-term bullish commodity scenario. However, harsh COVID restrictions that didn’t get rolled back until late-2022 sapped investment and consumer spending. Each has been disturbingly slow to recover.

The devastating supply chain issues that were revealed during the pandemic put pressure on international companies to repatriate some key manufacturing, or at least shorten and diversify supply lines. This means China could be facing disinvestment for some time to come.

Stimulus measures have thus far failed to shake free hoarded cash from Chinese businesses and consumers. Both are understandably worried about the level of authoritarian control exerted by Beijing over the past several years and fear that it could easily happen again.

Seems like a good reason to buy some gold.

Heightened political tensions between China and the U.S. further exacerbate the situation.

More than 61.8% of the June/July rally in silver has already been retraced and the 200-day SMA at $23.16 is under pressure. A convincing penetration of this level would shift focus to the 78.6% retracement level at $22.79. Beyond that, the June 23 low at $22.11 would be back in play.

A rebound above $24 is needed to ease short-term pressure on the downside. Such a move would suggest potential back to the July 20 high at $25.27.

PGMs

Platinum closed 1.6% lower last week. It was the third consecutive lower weekly close and the weakness extended into Monday’s session.

Spot Platinum Daily Chart through 8/7/2023

The PGMs are also being weighed by the economic situation in China, which is adversely impacting car and truck demand. Heavy monsoon rains and flooding in India have not been good for car and truck demand either.

Palladium is coiling near multi-year lows, but with the market already quite short, a rebound may be needed to attract renewed selling interest.


Non-Reliance and Risk Disclosure: The opinions expressed here are for general information purposes only and should not be construed as trade recommendations, nor a solicitation of an offer to buy or sell any precious metals product. The material presented is based on information that we consider reliable, but we do not represent that it is accurate, complete, and/or up-to-date, and it should not be relied on as such. Opinions expressed are current as of the time of posting and only represent the views of the author and not those of Zaner Metals LLC unless otherwise expressly noted.

Grant on Gold – July 24, 2023
Monday, July 24, 2023

Gold’s focus this week is squarely on the FOMC meeting. The two-day meeting begins on Tuesday with the policy announcement and Chairman Powell’s press conference set for Wednesday.

Spot Gold Daily Chart through 7/24/2023

 In the eyes of the market, a 25-bps rate hike is a foregone conclusion. Fed funds futures reflect a probability of 98.3%. That is largely the result of the ongoing tempering of U.S. inflation data.

June CPI data showed a full-point drop in annualized consumer inflation to 3.0% from 4.0% in May. June PPI fell to 0.1% y/y, versus a downward revised 0.9% y/y in May.

The market is widely anticipating that Fed will pause after this week’s hike. The target rate is then most likely to remain at 5.25% – 5.5% into Q1-2024. However, the policy statement will undoubtedly state that the rate path will be data-dependent.

What comes next though? Arguably growth risks remain in light of the rather dramatic series of rate hikes over the past 16 months. On the other hand, Vincent Deluard of StoneX believes we “should brace for second and third inflationary waves, as was the case in the 50s and 70s.”

The yellow metal set a 9-week high last week shy of the $2000 level, buoyed by a weaker dollar. The dollar index tumbled to a 15-month low on the belief that the Fed is on the verge of pausing, while other major central banks will continue their tightening campaigns.

While gold and the dollar have adopted corrective tones in more recent sessions, I see this as primarily associated with position squaring ahead of the Fed decision. If the policy statement is in line with expectations ­– without an over-the-top emphasis on data dependency – the dominant trends should resume.

Silver

Silver closed down 1.3% last week. It was the first lower weekly close in four.

Spot Silver Daily Chart through 7/24/2023

A key reversal did form on Thursday last week, so it was not surprising to see downside follow-through late last week and into Monday. Here too, we suspect some profit-taking ahead of the FOMC meeting.

Heightened growth risks may be putting some pressure on the more industrial metals as well. Preliminary US manufacturing PMI for July came in better than expected at 49, but the indicator appears on track for a third consecutive month of contraction.

Meanwhile, services PMI slumped to 52.4, well below expectations of 54. It was the sixth straight month of expansion, but the slowest pace since March.

According to the report: “The overall rate of output growth, measured across manufacturing and services, is consistent with GDP expanding at an annualized quarterly rate of approximately 1.5% at the start of the third quarter. That’s down from a 2% pace signaled by the survey in the second quarter.”

While economic growth slowed in July, there are plenty clinging to the notion of a soft landing. Let’s just say that my confidence in the Fed’s ability to orchestrate such an outcome is not particularly high.

I’m also somewhat concerned about the ongoing lack of investor interest, despite the (near-perfect) 78.6% retracement of the May-June decline. ETF outflows last week totaled 6.4Moz, leaving net holdings down more than 2% YTD.

The longer-term supply/demand fundamentals remain broadly favorable, and setbacks are likely to be viewed as buying opportunities.

PGMs

Platinum fell 1.1% last week but not before establishing a 5-week high at $998.43. The inability of the market to regain $1000 leaves the upside limited while the market awaits the Fed’s decision.

Spot Platinum Daily Chart through 7/24/2023

Consolidative range trading persists. A rebound above $1000 would set a more favorable tone within the $564.70/$1339.35 range.

Palladium remains defensive near 4½-year lows.


Non-Reliance and Risk Disclosure: The opinions expressed here are for general information purposes only and should not be construed as trade recommendations, nor a solicitation of an offer to buy or sell any precious metals product. The material presented is based on information that we consider reliable, but we do not represent that it is accurate, complete, and/or up-to-date, and it should not be relied on as such. Opinions expressed are current as of the time of posting and only represent the views of the author and not those of Zaner Metals LLC unless otherwise expressly noted.

Grant on Gold – June 5, 2023
Monday, June 5, 2023

Gold remains defensive below the $2000 level as ongoing strength in the labor market keeps the threat of inflation highlighted. That in turn makes it difficult to rule out further rate hikes.

Spot Gold Daily Chart through 6/5/2023

U.S. nonfarm payrolls for May came in at a solid +339k, well above market expectations of +193k, versus a positively revised +294k in April. While the unemployment rate rose to 3.7%, strength in the payrolls numbers diminishes the likelihood that a recession is impending.

This also seems to provide some additional leeway for the Fed to further tamp inflation with another rate hike this month, although that’s not really being reflected in Fed funds futures yet. The CME’s FedWatch tool puts the probability of a 25-bps rate hike at 24.1% as of Monday.

The resolution of the latest debt-ceiling standoff has taken some of the haven bid out of gold. While default has been averted, there doesn’t seem to be any palpable sense of relief.

The debt ceiling has been suspended until January 2025, allowing Treasury to borrow as much as it wants until the debt ceiling is reinstated. The CBO projects total debt held by the public to grow to $27.4 trillion by the end of 2024 and exceed 100% of GDP. Gross debt is expected to be north of $34 trillion.

Federal Debt Held by the Public, 1900 to 2053

By the end of 2033, total debt held by the public is projected to rise to $46.4 trillion, and 118.2% of GDP. Gross debt at the end of 2033 will be approaching $52 trillion.

Those numbers and that chart – especially the trajectory – are reasons for considerable concern. The debt and the servicing costs are an ever-growing millstone around the neck of economic growth potential.

While this is certainly a grim reality for the U.S., the explosion of debt is a global phenomenon.

A recent report by the consultancy group McKinsey found that since 2000, “Globally, for every $1.00 of net investment, $1.90 of additional debt was created.” This was largely due to rising debt levels and quantitative easing (money printing). During 2020 and 2021, “The creation of new debt accelerated to $3.40 for each $1.00 in net investment.”

That’s pretty staggering. Not surprisingly, investors are wondering where they can turn to safeguard their wealth. A recent Bloomberg survey showed that 52% of professional investors and 46% of retail investors picked gold as their top safety choice. Treasuries were a distant second at 14% and 15% respectively.

According to a Gallup poll gold has vaulted into second place for the best long-term investment, behind real estate. According to the poll, gold is now comfortably favored above stocks/mutual funds, Savings accounts/CDs, and bonds.

It’s worth recalling that the world’s central banks have been buying gold voraciously. Central Bank gold buying reached a record 1,078 tonnes in 2022. This year is off to a strong start as well, with Q1 demand hitting a record 228 tonnes, 34% higher than the previous Q1 record set in 2013.

While much has been said in recent weeks about gold weakness stemming from a stronger dollar, keep in mind that the yellow metal is only about $100 (less than 6%) off its all-time high of $2075.28. Savvy investors will likely view short-term setbacks as buying opportunities.

Silver

Silver ended May with a loss of 6%. It was the first lower monthly close in three, as uncertainty over the debt ceiling and growth risks worried investors.

Spot Silver Daily Chart through 6/5/2023

Resolution of the debt ceiling crisis – or perhaps more accurately forestalling of the real crisis – along with optimistic economic data may help put a floor under silver. Supply and demand fundamentals remain broadly supportive, but investors remain reticent.

Silver ETF saw outflows of 2.5 Moz last week. Holdings declined by 838 koz on Friday alone, even after the impressive NFP beat.

Additional retracement of the recent losses is needed to re-instill a measure of confidence in the scenario that calls for an eventual retest of the $30 zone. A rise back above $24.50 might spark some interest among those investors.

What those investors should really be looking at are the realities of incredibly strong demand in just about every sector of the physical silver market. At the same time, the market is in deficit and is projected to remain in deficit for the next five years.

That bodes well for the longer-term outlook which should carry silver to new record highs. It’s a pretty compelling story for investors, but they just aren’t paying attention at this point.

PGMs

Platinum is maintaining a corrective stance, although Monday’s rebound offers some encouragement. The industrial metals didn’t like the strong nonfarm payrolls number on Friday as it heightened the possibility of further Fed rate hikes.

Spot Platinum Daily Chart through 6/5/2023

While total vehicle sales dipped in May to 15.6M from 16.6M in April, the general trend seems to suggest the potential for a return to the pre-pandemic level of around 17.5M units.

I remain cautiously bullish on platinum. If the U.S. can avert a recession, as suggested by persistently strong incoming data, scope is seen for a near-term retest of $1200.

Palladium continues to bounce along the bottom, within striking distance of the 4-year low at $1329.18.


Non-Reliance and Risk Disclosure: The opinions expressed here are for general information purposes only and should not be construed as trade recommendations, nor a solicitation of an offer to buy or sell any precious metals product. The material presented is based on information that we consider reliable, but we do not represent that it is accurate, complete, and/or up-to-date, and it should not be relied on as such. Opinions expressed are current as of the time of posting and only represent the views of the author and not those of Zaner Metals LLC unless otherwise expressly noted.