• +1 (312) 549-9986

Gold $4,037.02 $(106.72) -2.58% Silver $54.83 $(3.33) -5.73% Platinum $1,572.12 $(59.93) -3.67% Palladium $1,057.55 $(35.15) -3.22%
RSS

Blog posts tagged with 'economy'

Zaner Precious Metals Commentary
Friday, October 16, 2026

Gold and silver recover on Friday, but elevated yields and a strong dollar remain headwinds

Outside Market Developments: Fed Chairman Warsh participated in a fireside chat at the IMF/World Bank meeting in Bangkok, Thailand, last night. The trade was hoping for some reaction to this week's hot inflation data and perhaps a hint of forward guidance.

True to form, Warsh continues to play his cards close to the vest. He mentioned inflation only in general terms as a “common challenge” globally, adding that he does not “pre-judge” before FOMC meetings.

From his confirmation hearing onward, Warsh has maintained that he does “not believe in forward guidance” and does not think the Fed “should be signaling future decisions in advance.” He has yet to rein in the rest of the FOMC members, however, who have tilted hawkish in recent weeks.

Chicago Fed President Goolsbee called the CPI and PPI data "discouraging" on Thursday. He still holds “some optimism” that the inflation drivers may be temporary (tariffs, Middle East conflicts/supply disruptions) and could fade quickly. However, he has expressed some concerns recently that inflation is shifting from temporary supply shocks to more persistent demand-driven overheating that is partly linked to AI investment. The blackout period for the October 27–28 FOMC meeting begins tonight at midnight Eastern Time.

While annualized CPI reached multi-month highs, and PPI surged to multi-year highs, most of the inflationary pressure was attributable to energy. Perhaps reflecting some hope that energy pressures will soon moderate, Fed rate-hike expectations moderated late in the week.

Fed funds futures now put the odds of an October rate hike at 12.7%, versus  27.7% on Thursday. The implied Fed funds rate for year-end is 4.07%, implying just 19.5 bps of tightening.

It’s worth remembering that the current U.S. fiscal situation poses a meaningful constraint on further Fed tightening. Debt-servicing costs for FY 2026 (ended 30) exceeded $1 trillion, making net interest a larger budget item than both defense and Medicare – and second only to Social Security. A 25 bp rate hike would add roughly $18 billion to annual interest costs. Under current law, the CBO projects interest payments on the debt will continue rising, reaching about $2.1 trillion by 2036.

Iran-backed Houthi rebels launched missile strikes on Yemen’s presidential palace in Aden on Thursday, killing several people and wounding others, while Saudi Arabia intercepted additional missiles and drones targeting its territory. In an interview, President Trump ruled out using ground troops against Iran but left open the possibility of further conventional strikes, as tensions persist around the Strait of Hormuz and energy infrastructure. 

The Russia-Ukraine "energy ceasefire" that President Trump announced last weekend has collapsed...if it ever really existed. Ukraine resumed strikes on Russian refineries, claiming Moscow never refrained from hitting Ukrainian power and gas facilities. Brent crude retested the September high above $111.

Next week, markets will primarily focus on a heavy slate of major corporate earnings, led by high-profile reports from Netflix (Tuesday), Tesla and Meta (Wednesday), and Procter & Gamble (Thursday), which will offer fresh insights into consumer spending, tech/AI demand, and broader economic resilience. Oil prices will remain a key interest. Attention will also turn to U.S. housing data (starts and permits on Tuesday), and UofM consumer sentiment (Friday). This week's hot inflation readings will remain a significant backdrop, and the trade will continue to refine Fed policy expectations ahead of the October FOMC meeting.


GOLD

OVERNIGHT CHANGE THROUGH 6:00 AM CT: +$3.48 (+0.08%)
5-Day Change: -$19.77 (-0.47%)
YTD Range: $3,945.52 - $5,595.02
52-Week Range: $3,887.03 - $5,595.02
Weighted Alpha: -5.25

Gold rebounded to pressure $4,200 in early U.S. trading on Friday, buoyed by softer yields and a pullback in the dollar. A close above $4,194.29 today would confirm a second straight higher weekly close, with a potential double bottom already providing some technical encouragement for the bull camp.


Last week's low at $4,067.07 successfully contained tests of the downside earlier in the week, leading to that as yet confirmed double bottom. Confirmation would occur on a breach of resistance at $4,217.02 (12-Oct high). This level is bolstered by the 2-Oct high at $4,225.02, and the declining 100-day moving average will move into this zone next week as well.

Given the recent rejections above $4,200, there are likely significant buy stops above those highs that the bulls will be tempted to run if they are given the opportunity. Such a move would shift focus to the $4,307.44 Fibonacci level and the 50-day MA at $4,331.32. Above the latter, the more important 50% retracement level of the Aug/Oct decline at $4,381.69 would attract.

Hot inflation readings with a tempering of hawkish Fed expectations may also be allowing the yellow metal to reassert itself as the classic hedge against rising prices. Safe-haven demand provides additional underpinning amid persistent fiscal and geopolitical risks.

On the downside, today's Asian low at $4,147.59 and Thursday's low at $4,100.39 protect the recent lows at $4,073.90/$4,067.07. With the fortification of the downside, I'm feeling a little better about my belief that the low is in at $3,945.52 (30-Jun), but the relative weakness in silver is still troubling.


SILVER

OVERNIGHT CHANGE THROUGH 6:00 AM CT: +$0.282 (+0.49%)
5-Day Change: -$3.034 (-4.99%)
YTD Range: $54.778 - $121.630
52-Week Range: $45.563 - $121.630
Weighted Alpha: -2.95

Silver has lost about 6% this week and is poised for its sixth weekly loss out of the last eight. While the white metal is higher today on position squaring, the drop to a 13-week low on Wednesday suggests the summer low at $54.778 is vulnerable to a more serious challenge.


High yields and a strong dollar continue to provide a significant headwind. There's also growing concern about waning industrial demand. Part of that is attributable to rising financing costs that threaten to slow AI infrastructure expansion. 

Solar/photovoltaic sector demand has also cooled as the peak season wound down. Umicore noted that HSBC forecasts a decline in industrial demand from 642 Moz in 2026 to 618 Moz in 2027, due in part to cost-cutting and substitution in the solar sector.

A convincing move above $60 is needed to ease pressure on the downside somewhat, but the key 20-, 100- and 50-day moving averages are the more important levels to be watching. A breach above the 50-day at $63.974 would shift focus to the September highs above $68.


Peter A. Grant
Vice President, Senior Metals Strategist
Zaner Metals LLC
312-549-9986 Direct/Text
[email protected]
www.zanermetals.com


Non-Reliance and Risk Disclosure: The opinions expressed here are for general information purposes only and should not be construed as trade recommendations, nor a solicitation of an offer to buy or sell any precious metals product. The material presented is based on information that we consider reliable, but we do not represent that it is accurate, complete, and/or up-to-date, and it should not be relied on as such. Opinions expressed are current as of the time of posting and only represent the views of the author and not those of Zaner Metals LLC unless otherwise expressly noted.

Zaner Precious Metals Commentary
Wednesday, October 14, 2026

Gold and silver weighed by hot CPI print

OUTSIDE MARKET DEVELOPMENTS: Headline CPI rose 0.6% in September, in line with expectations, versus +0.4% in August. The annualized rate of consumer inflation jumped to 3.7% y/y, above the 3.6% consensus and up from 3.4% in August. Core came in at +0.3% on expectations of +0.2%; 2.6% y/y on expectations of 2.5%, versus 2.4% in August.

Stocks turned lower, Treasury yields jumped, and the dollar strengthened as traders raised bets on further Fed rate hikes.
Odds of an October rate hike rebounded to 50% from 22.1% yesterday and 17.7% a week ago, though many still view a December move as more likely.


FedSpeak continues to tilt hawkish. NY Fed President John Williams believes another rate increase this year may be appropriate. “I haven’t changed my view that it may be appropriate to have one more rate hike... I don’t think at this time I have any reason to believe that we would need to do more” after that," he said. 

Market focus now turns to tomorrow's PPI data, where analysts are expecting inflation to moderate slightly. Consensus estimates are (headline) 5.3%, and (core) 4.4%. September retail sales data will also be released tomorrow, and the pace of consumption is expected to slow.

Iranian officials have acknowledged deploying new tactics to target ships in the Strait of Hormuz in an effort to keep oil prices elevated. Yemen’s Iran-backed Houthis have also escalated attacks on Saudi Arabia, striking an Aramco administrative building in Dhahran and launching missiles toward Riyadh that were intercepted. Oil prices remain elevated amid heightened supply-risk concerns, which continue to stoke inflation and Fed tightening expectations.

Bank of America faces more than $1.21 bln in U.S. regulatory penalties, primarily a $1.2 bln fine from FinCEN for major anti-money laundering shortcomings. The bank failed to timely report over $5 bln in suspicious transactions, including activity linked to Chinese money-laundering networks. The bank was also hit with a record $750M OCC penalty plus a smaller OFAC sanctions settlement.


GOLD

OVERNIGHT CHANGE THROUGH 6:00 AM CT: -$20.26 (-0.49%)
5-Day Change: +$34.80 (+0.85%)
YTD Range: $3,945.52 - $5,595.02
52-Week Range: $3,887.03 - $5,595.02
Weighted Alpha: -6.18

Gold sold off in reaction to this morning's hotter-than-expected inflation readings, which sparked a rebound in Fed-tightening expectations and lifted yields and the dollar. So far, last week's low at $4,067.07 has contained the downside, but the surge in the dollar and sharp losses in silver suggest the downside is vulnerable.


If the yellow metal does take out that low, focus will shift to the August low at $4,022.62 with potential to the $4,000 zone. My preferred scenario has been that the low for the year at $3,945.52 will hold, but my confidence has been shaken.

Intraday resistance at $4,105.77/$4,107.08 now provides an intervening barrier ahead of the overseas high at $4,170.19. The more important level on the upside is defined by the recent highs at $4,217.02/$4,225.02, and bolstered by the falling 20-day MA at $4,210.15.

At last week’s LBMA Conference in Sorrento, Italy, delegates predicted gold would average around $5,013 in 12 months, more than 20% above current levels. The bullish outlook stems from structural drivers such as rising global government debt concerns, ongoing geopolitical fragmentation that elevates gold’s role as a neutral reserve asset, and continued strong central-bank buying. Bundesbank President Joachim Nagel emphasized that gold still accounts for a growing share of reserves and remains a key diversifier that cannot default or be easily restricted.


SILVER

OVERNIGHT CHANGE THROUGH 6:00 AM CT: -$0.709 (-1.20%)
5-Day Change: -$1.059 (-1.77%)
YTD Range: $54.778 - $121.630
52-Week Range: $45.563 - $121.630
Weighted Alpha: -0.72

Silver plunged to three-month lows following this morning's CPI report, as yields pressured recent multi-decade highs and the dollar index reached 18-month highs. The white metal has been significantly more volatile than gold amid broader risk-off sentiment. The gold/silver ratio is trading above 73 for the first time since December.


With last week's low at $58.516 and the $58.272 Fibonacci level negated, the late-July lows at $56.681/$56.583 are in play. Below the latter, the low for the year at $54.778 (17-Jul) defines key support.

Minor intraday resistance at $56.476 stands in front of the early U.S. high at $57.778. Above that, the $60 zone is likely to keep Monday's high at $61.451 at bay.  The falling 20-day MA (currently $61.920) should correspond closely with the high for the week over the next session or two. 


Peter A. Grant
Vice President, Senior Metals Strategist
Zaner Metals LLC
312-549-9986 Direct/Text
[email protected]
www.zanermetals.com

Non-Reliance and Risk Disclosure: The opinions expressed here are for general information purposes only and should not be construed as trade recommendations, nor a solicitation of an offer to buy or sell any precious metals product. The material presented is based on information that we consider reliable, but we do not represent that it is accurate, complete, and/or up-to-date, and it should not be relied on as such. Opinions expressed are current as of the time of posting and only represent the views of the author and not those of Zaner Metals LLC unless otherwise expressly noted.

Grant on Gold – October 16, 2023
Monday, October 16, 2023

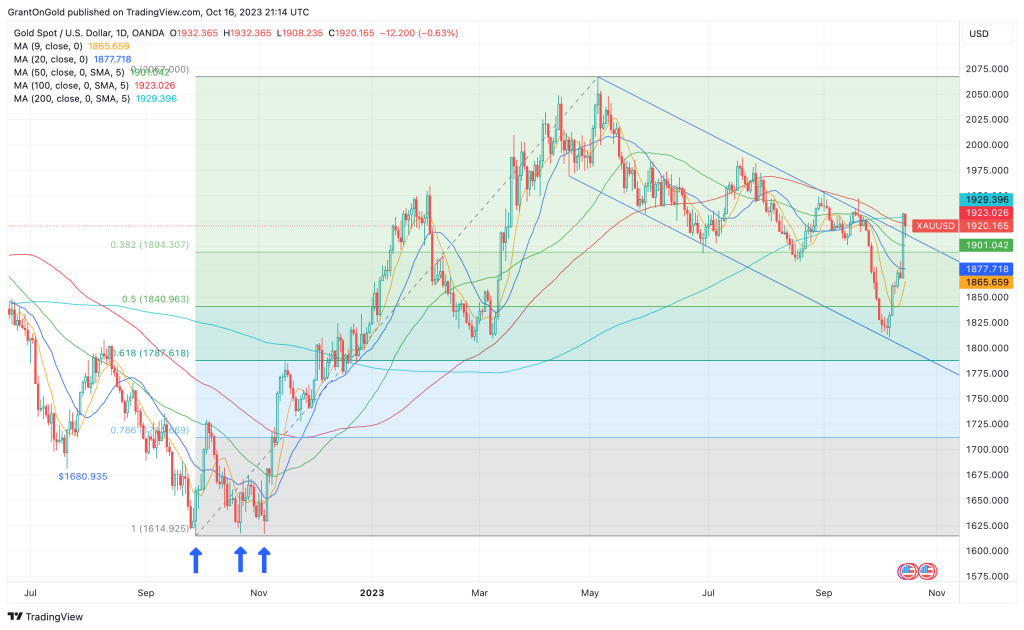
Gold surged nearly 5.5% last week, spurred by safe-haven buying in the wake of the horrific October 7th attack on Israel.  While downside retracement was seen on Monday, the initial push back above the $1900 level leaves the low end of the bear channel well protected for the time being.

Spot Gold Daily Chart through 10/16/2023

With an Israeli ground offensive into Gaza thought to be imminent, and amid worries that the conflict could expand, look for the yellow metal to remain underpinned. Iran has warned Israel of “far reaching consequences” should they launch a ground invasion.

Gold is garnering additional lift from rising hopes that the Fed is done raising rates this year. The CME’s FedWatch tool puts the probability of a November rate hike at just 5.2%, while the odds for a December rate hike stand at 32.7%.

While PPI rebounded in September to 2.2% y/y, and CPI held steady at 3.7%, members of the Fed still seem to be encouraged by the progress in the fight against inflation.

“Absent a stark turn in what I see in the data and hear from contacts … I believe that we are at the point where we can hold rates where they are,” said Philadelphia Fed President Patrick Harker. Raphael Bostic of the Atlanta Fed stated last week that he does not believe that the FOMC needs to hike again.

There is still a wide belief that the Fed’s next move is very data-dependent. The present stance has been categorized as a “hawkish hold.” As long as the trajectory for inflation is down, the central bank will likely keep rates as they are.

Monday’s low at $1908.23 now provides a good intervening support level ahead of the 38.2% retracement level of the rally off the $1810.46 low, which comes in at $1886.14.

On the upside, the next tier of resistance is found at $1947.46/$1953.06. A breach of this area would exceed the halfway back point of the entire decline off the $2067.00 high from May, shifting focus to the 61.8% retracement level at $1969.00.

As long as geopolitical tensions remain elevated and nearby supports are intact, setbacks into the range are likely to be viewed as buying opportunities.

While haven flows have gold and the dollar moving generally in tandem at the moment, keep an eye on that relationship for short-term directional cues.

Silver

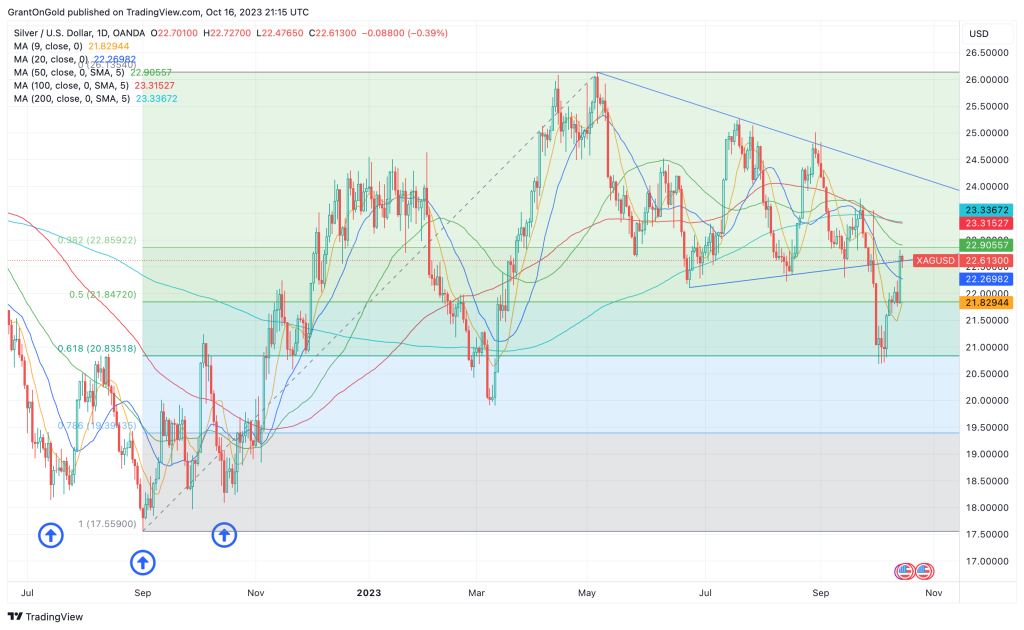
Silver rose just over 5% last week as outside forces stoked market volatility. Despite the strong rally, additional gains are needed to set a more favorable technical tone.

Spot Silver Daily Chart through 10/16/2023

A rebound above $23.41 would constitute a 50% retracement of the decline from the May high at $26.14. It would also put silver back above its 100- and 200-day moving averages. This would have rather bullish implications.

A retreat below $21.80/75 would return focus to the bearish scenario that has dominated since the downside breakout of the large triangle pattern. Such a move would return focus to the $20.68 low from October 3 and highlight the low for the year at $19.90 once again.

While silver followed gold higher last week, the white metal is probably more concerned about the implications of another war on regional and global growth, as well as prices. If signs of stagflation begin to surface, silver would likely remain defensive.

PGMs

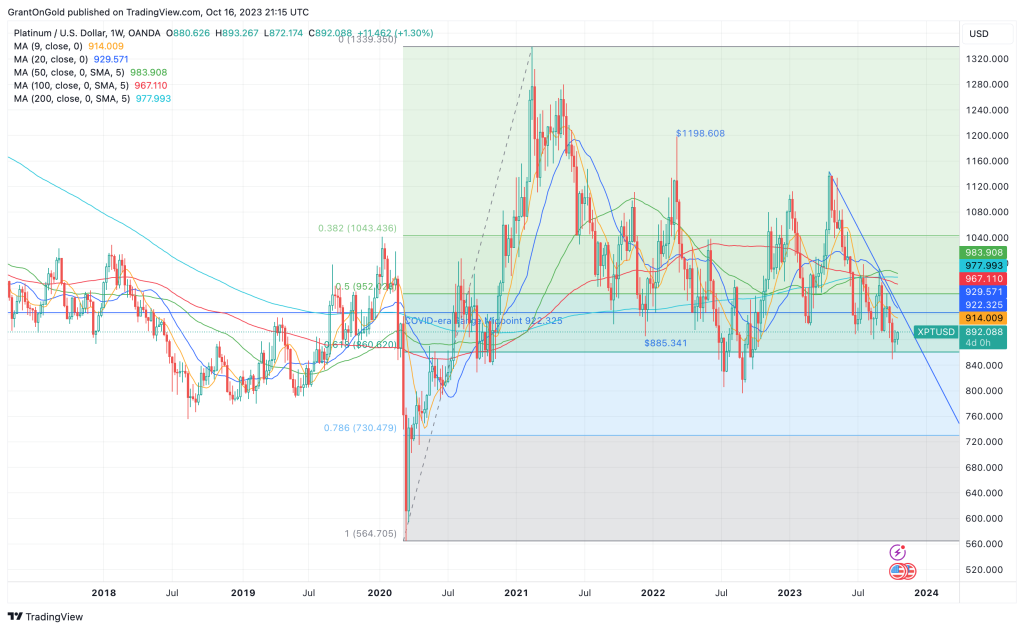
Platinum was comparatively subdued last week, rising a scant 0.5% with activity confined to the previous week’s range. Consolidative trading prevailed on Monday.

Spot Platinum Daily Chart through 10/16/2023

The short-term technical bias remains negative with platinum below the midpoint of the COVID-era range and all the important moving averages.

Palladium remains weak after sliding to fresh 5-year lows two weeks ago. The next support level to watch is defined by a measuring objective and a Fibonacci level at $1088.38/$1085.50.


Non-Reliance and Risk Disclosure: The opinions expressed here are for general information purposes only and should not be construed as trade recommendations, nor a solicitation of an offer to buy or sell any precious metals product. The material presented is based on information that we consider reliable, but we do not represent that it is accurate, complete, and/or up-to-date, and it should not be relied on as such. Opinions expressed are current as of the time of posting and only represent the views of the author and not those of Zaner Metals LLC unless otherwise expressly noted.
Grant on Gold – September 25, 2023
Monday, September 25, 2023

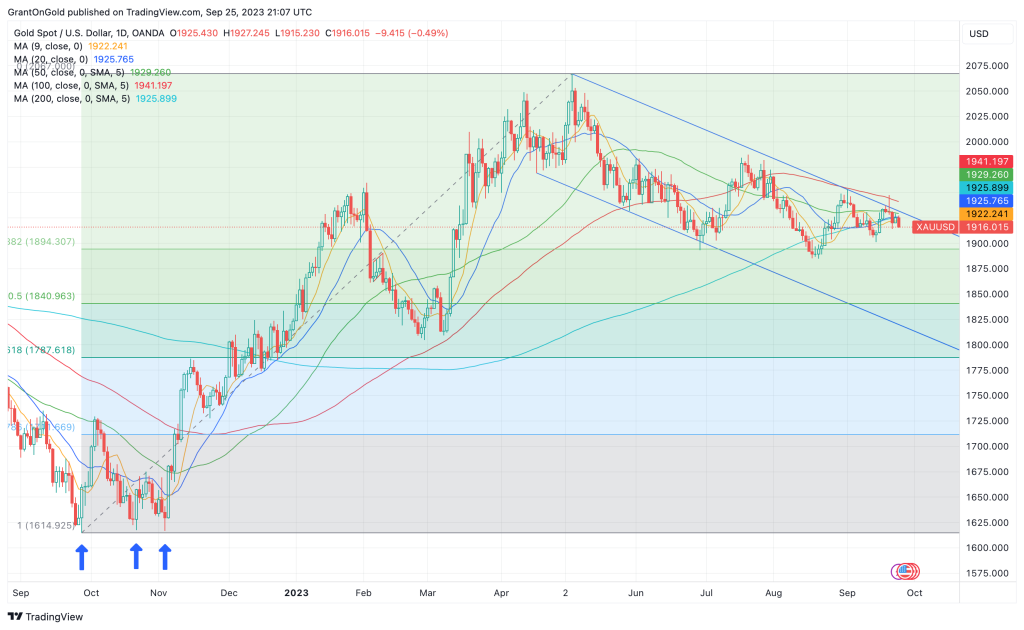
Gold continues to consolidate in the bearish channel that dominated throughout the summer. The 100-day MA successfully contained the upside last week, leaving the downside vulnerable to further tests.

Spot Gold Daily Chart through 9/25/2023

Last week the Fed held steady on rates, as was widely expected. However, Chairman Powell noted strength in the economy and his desire to see “convincing evidence” that inflation is moderating.

The dot plot suggested that at least one more rate hike could be seen this year. Perhaps more importantly, the dots reinforced the ‘higher for longer’ scenario with the first rate cut now forecast for June 2024.

The 10-year yield moved more convincingly above 4% on Monday, reaching levels not seen since 2007. Higher yields are buoying the greenback. The dollar index extended on Monday to reach 10-month highs.

Higher yields and a higher dollar will continue to pose a considerable headwind for gold. Mounting global growth risks apply additional weight.

It is believed that the Eurozone economy contracted in Q3, even as inflation remains elevated. September CPI is forecast to be 4.5%. While that’s down from 5.2% in August, the inflation rate remains well above target.

Earlier in the month, the ECB hiked rates for a 10th consecutive meeting, pushing the deposit rate to a record high of 4%. Analysts now believe the ECB is on hold, probably into next summer.

However, the ECB also will want to see some convincing evidence to confirm that inflation has been squelched in the EU. Until that happens, at least one more rate hike can’t be ruled out.

Of course, worries about the Chinese economy persist as well. This could have grim implications for the global economy.

Chinese demand for imports has contracted in nine of the last 10 months. If China slips into recession, there are concerns that demand for commodities will suffer further. While that may help tamp inflation, the demand destruction will be the greater concern in the medium term.

The ongoing expansion of official gold reserves remains a bright spot for the yellow metal. Central banks continue to seek diversification, mainly out of dollars and into gold.

While central bank gold demand slowed in Q2, the record purchases in Q1 led to record H1 demand of 387 tonnes. Turkey was a big seller in April and May before resuming purchases in June.

The World Gold Council believes the Turkish sales were “tactical rather than strategic” amid internal economic and political strife. Interestingly, as the TCMB was selling, demand for bars, coins, and gold jewelry surged in the country as citizens sought to protect their wealth against a devaluing lira.

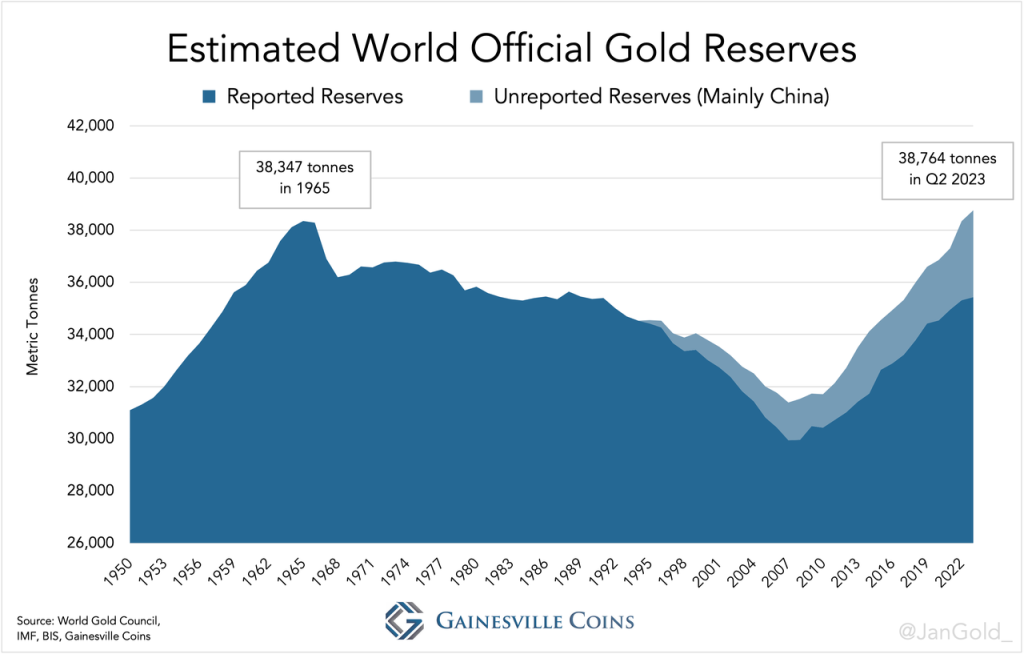
Estimated World Official Gold Reserves

Taking into consideration estimates of China’s unreported gold reserves, analyst Jan Nieuwenhuijs of Gainesville Coins believes world reserves reached an all-time high of 38,764 tonnes in Q2. If that’s an accurate assessment, it exceeds the previous record of 39,347 tonnes from 1965.

Nieuwenhuijs points out that gold as a percentage of total global reserves currently stands at 17%, while the long-term historical average is 58%. That suggests there remains considerable potential for further central bank gold buying.

If gold were once again to make up the majority of global reserves, one of Jan’s models projects a price in excess of $8,000 over the next 10 years.

Silver

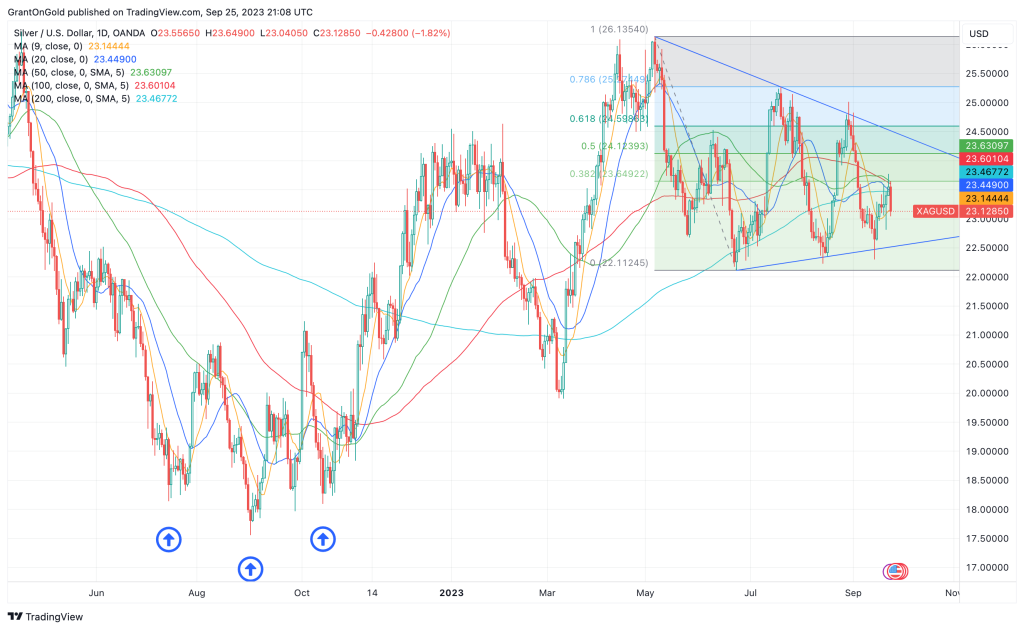
Silver continues to trade in a choppy manner within the confines of a large symmetrical triangle pattern. The white metal rose more than 2% last week, but most of those gains were given back on Monday.

Spot Silver Daily Chart through 9/25/2023

The silver market is facing some of the same headwinds as the gold market. Perhaps most notably, sluggish demand for electronics in China is likely to adversely impact demand for silver.

The Chinese auto sector returned to growth in August, after contracting in June and July. Sales surged 8.5% m/m and 2.2% y/y with electric vehicles such as Teslas increasingly popular. However, the sustainability of these gains is in doubt as China’s real estate crisis threatens to sap consumer demand.

Real estate is the biggest contributor to Chinese GDP, so the crisis has the potential to drag the middle kingdom into recession. Growth risks in the world’s second-largest economy pose considerable risks to the global economy as a whole.

That being said, the global trend toward electrification keeps the long-term supply/demand fundamentals undeniably positive. Therefore, retreats into the range that has emerged this year are still likely to be viewed as buying opportunities.

Initial support is well-defined by the series of lows at $22.30, $22.22, and $22.11. This zone should keep the low for the year at $19.90 (10-Mar) at bay.

Last week’s high at $23.78 is now seen as the trigger for a retest of the upper reaches of the triangle pattern, which comes in around $24.50.

PGMs

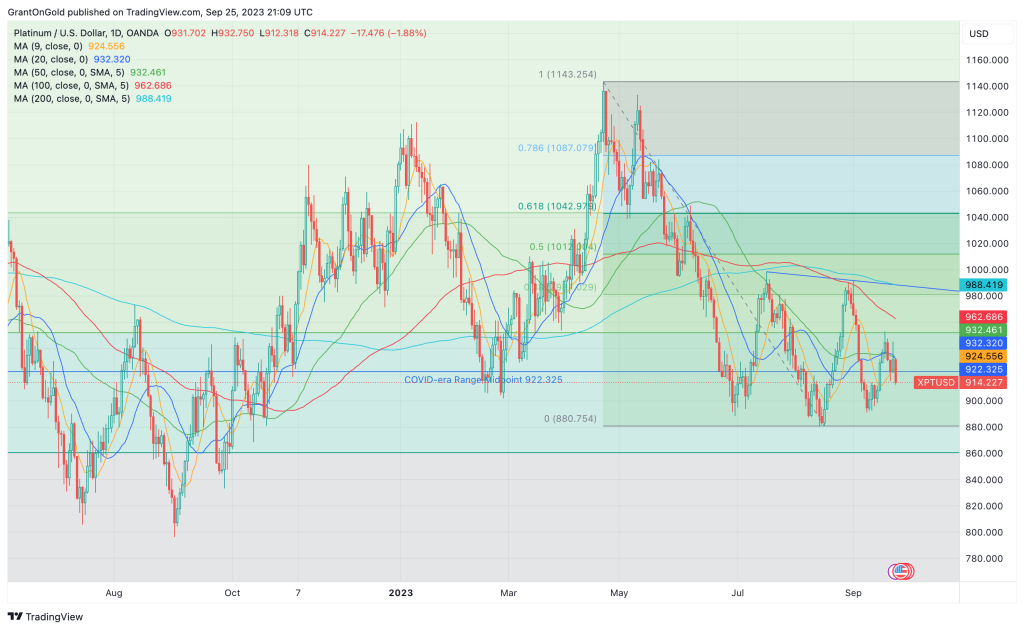
Platinum continues to struggle on upticks. The market rose modestly last week, notching a second consecutive higher weekly close. However, renewed selling pressure surfaced on Monday.

Spot Platinum Daily Chart through 9/25/2023

While U.S. auto sales were robust in August, global growth concerns continue to percolate below the surface. Rising interest rates also threaten to undermine consumer purchasing power.

Late-summer sales were helped by better supply, but if the expanding UAW strike persists the supply of new cars will tighten.   

Palladium remains defensive at the low end of the multi-year range.


Non-Reliance and Risk Disclosure: The opinions expressed here are for general information purposes only and should not be construed as trade recommendations, nor a solicitation of an offer to buy or sell any precious metals product. The material presented is based on information that we consider reliable, but we do not represent that it is accurate, complete, and/or up-to-date, and it should not be relied on as such. Opinions expressed are current as of the time of posting and only represent the views of the author and not those of Zaner Metals LLC unless otherwise expressly noted.
Grant on Gold – August 28, 2023
Monday, August 28, 2023

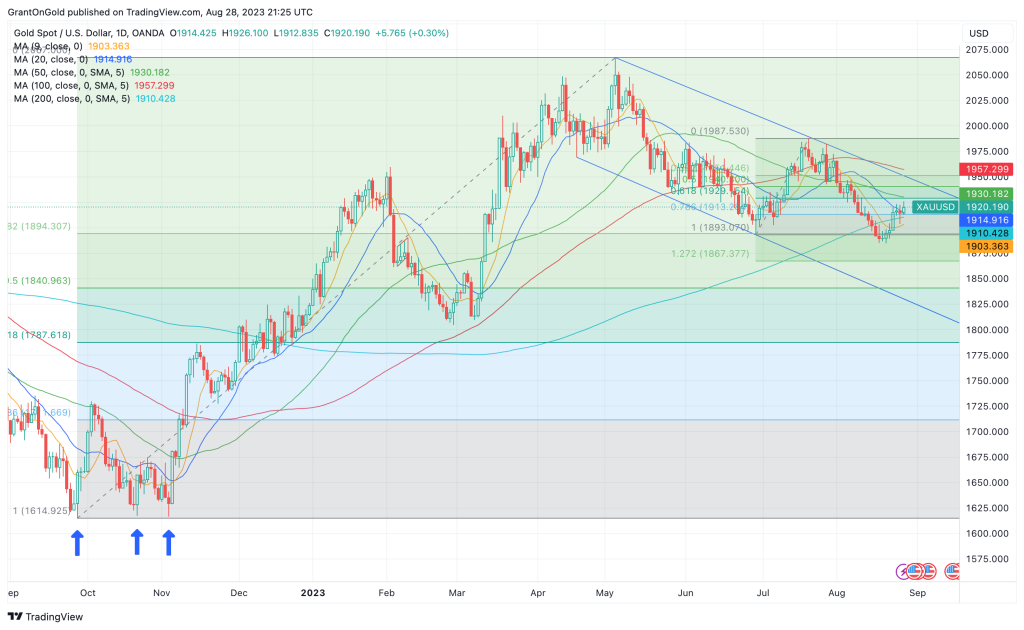
Gold fell to a 5-month low of $1884.88 last week but was unable to sustain losses below $1900 despite rather hawkish FedSpeak from Chairman Powell at the Jackson Hole Symposium. The yellow metal was able to post a 1.3% weekly gain, its first in five weeks.

Spot Gold Daily Chart through 08/28/2023

Powell acknowledged that inflation has come down some, but it remains too high. He warned that further rate hikes could be in the offing.

“We are prepared to raise rates further if appropriate and intend to hold policy at a restrictive level until we are confident that inflation is moving sustainably down toward our objective.”– Fed Chairman Jerome Powell

The 10-year Treasury yield reached 4.35% early last week, a level not seen since 2007. While rates moderated in subsequent trading this is likely attributable to profit-taking in advance of the Powell speech rather than any real shift in the perception of policy guidance.

The market certainly seems to be leaning toward “higher for longer” with perhaps some new risk for more rate hikes. However, the hawkish bias remains very much data-dependent.

This week happens to be chock full of U.S. data, including home prices, consumer confidence, GDP, PCE, and nonfarm payrolls. These data points and others in the weeks and months ahead will probably have a greater impact on the rate path than any Fed jawboning.

Interestingly, while the 10-year yield reached a 16-year high, the dollar index is thus far holding below the 104.24 high from May 31. It seems like the dollar should be garnering far more support from the rise in yields. And by extension, gold should be under greater pressure.

The greenback’s share of global reserves has gradually eroded over the past 20 years. News that BRICS membership will more than double as of January 1, 2024, and rumblings of a joint currency conspire to further undermine dollar hegemony.

Speculation that the BRICS currency will at least partially be backed by gold makes for a pretty compelling case to lighten dollar exposure in favor of the yellow metal. This investment theme is already being embraced by a number of central banks.

Silver

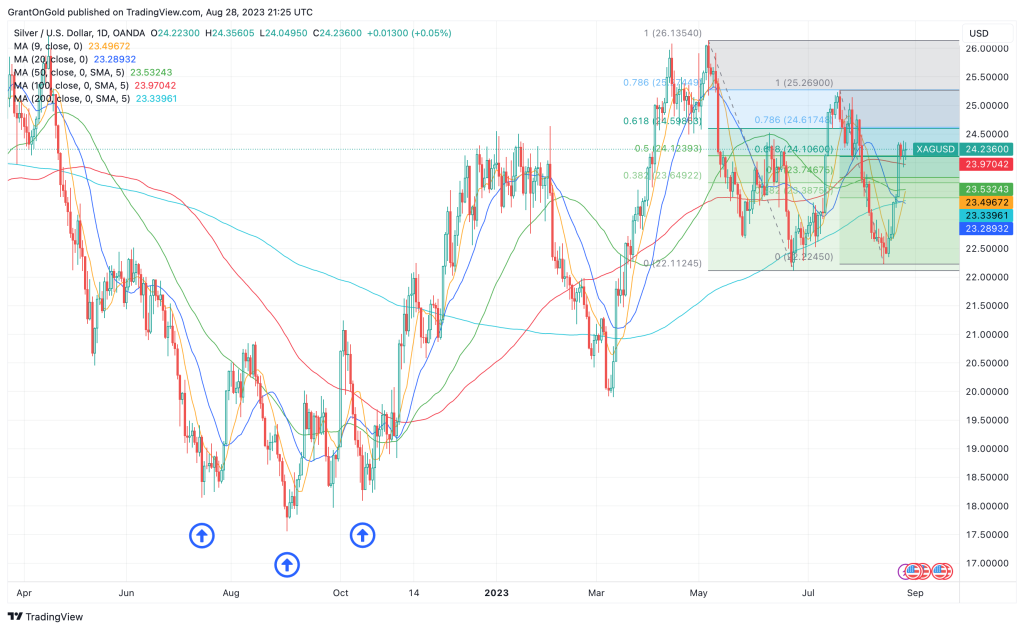
Silver snapped back smartly last week, gaining more than 6%. It was the white metal’s second consecutive higher weekly close.

Spot Silver Daily Chart through 08/28/2023

While China has taken a measured approach to stimulus thus far, there seems to be a growing expectation that the Chinese government will deliver more robust measures to prevent a recession in the world’s second-largest economy.

With substantial currency reserves at its disposal, China has the means for large-scale fiscal stimulus. There is historic precedence as well.

However, silver is not out of the woods yet. The range that was established in June and July remains intact at this point. I’m also not seeing the recent gains mirrored in the copper market.

Despite last week’s rally, silver ETFs saw outflows of 6.3 Moz. Holdings are down 3.6% YTD.

Until investors come back to the market, I have to consider the downside still vulnerable. However, the longer-term supply/demand dynamics remain favorable.

PGMs

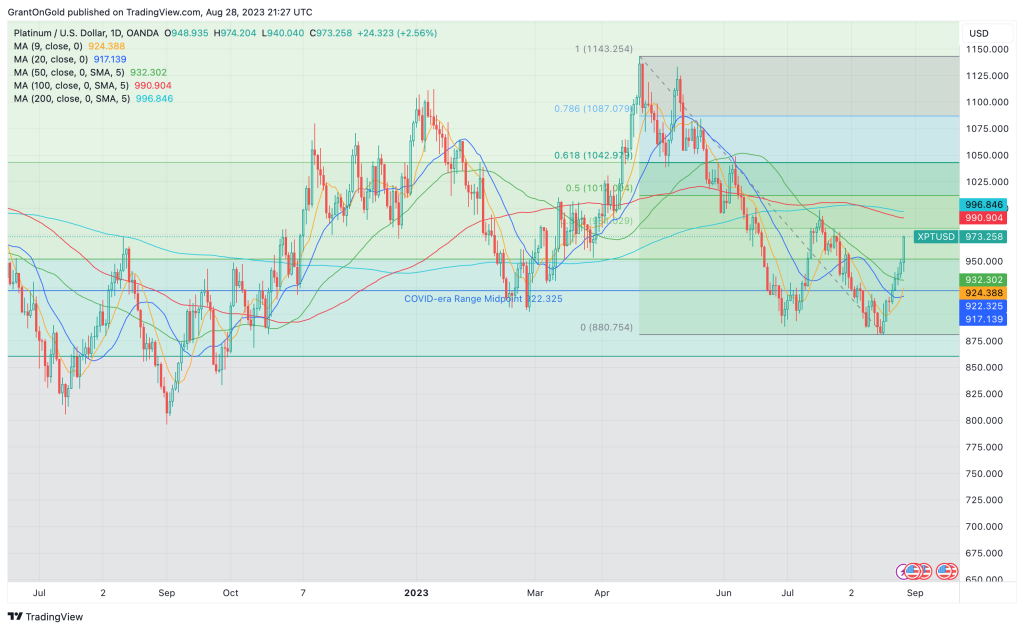
Platinum rose nearly 4% last week. It was the second consecutive higher weekly close and an additional upside extension (2.6%) was seen on Monday. Most of the declines off  

Spot Platinum Daily Chart through 08/28/2023

Here too, while the long-term fundamentals remain broadly favorable, higher U.S. rates and the negative impact on auto demand, as well as persistent worries about the Chinese economy are seen as limiting to the upside.

Palladium continues to consolidate at the low end of the range, still within striking distance of multi-year lows.


Non-Reliance and Risk Disclosure: The opinions expressed here are for general information purposes only and should not be construed as trade recommendations, nor a solicitation of an offer to buy or sell any precious metals product. The material presented is based on information that we consider reliable, but we do not represent that it is accurate, complete, and/or up-to-date, and it should not be relied on as such. Opinions expressed are current as of the time of posting and only represent the views of the author and not those of Zaner Metals LLC unless otherwise expressly noted.
Grant on Gold – August 14, 2023
Monday, August 14, 2023

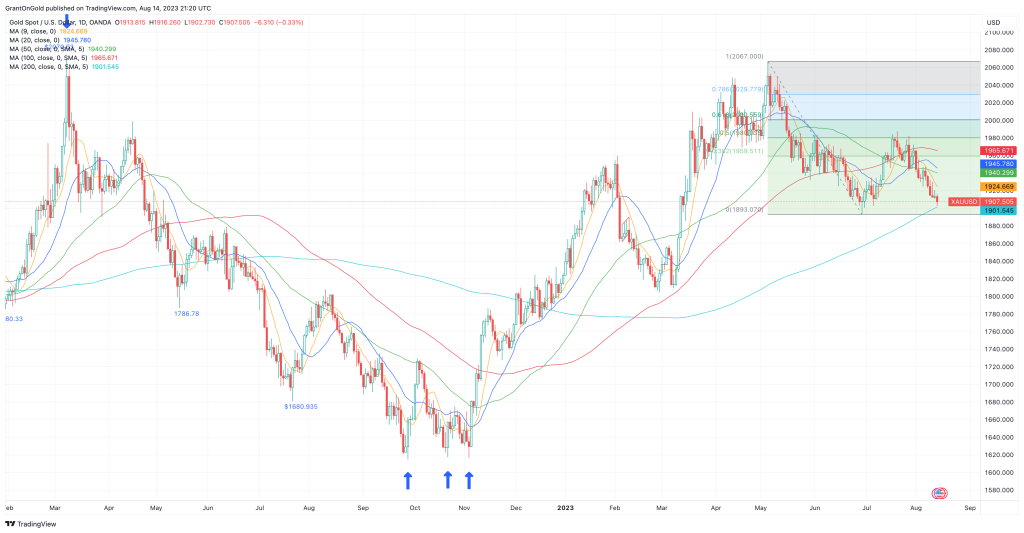
Gold remains on the defensive after seeing a third consecutive lower weekly close last week and extending to a 6-week low on Monday of $1902.73. Concerns about the Chinese economy and some uncertainty as to whether the Fed’s tightening cycle is over have conspired to weigh on a broad range of commodities.

Spot Gold Daily Chart through 8/14/2023

Last week’s U.S. inflation data suggests that the recent cooling trend in prices has at a minimum slowed, and possibly reversed. July CPI ticked up to 3.2% y/y, versus 3.0% in June. PPI rose to 0.8% y/y in July, versus 0.2% in June.

Lingering inflation along with the July nonfarm payrolls miss sparked a modest uptick in expectations for a rate hike before year-end. However, the market is still fairly convinced that the Fed will hold steady at its next meeting in September.

The heightened prospects for tighter monetary policy pushed the 10-year yield back within striking distance of the October high at 4.337%. The dollar index followed yields higher to set a 5-week high on Monday, adding additional weight to the yellow metal.

Interest rates have already risen dramatically since the Fed’s tightening cycle began back in March of 2022. The Fed funds rate has gone from 0% to 5.25-5.5%. That’s a significant rise in the cost of carrying debt at a time when the country’s and individual debt loads are on the rise.

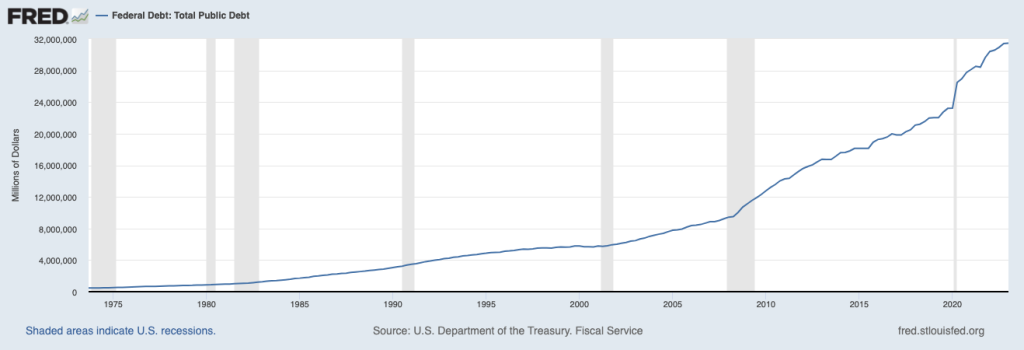
The national debt stood at $31.5 trillion as of Q1-2023. Estimates now put the debt load closer to $32.7 trillion. If that number is accurate, nearly $10 trillion has been added to the national debt in just the last several years alone since the beginning of the COVID crisis. That’s a surge of more than 40%!

Federal Debt: Total Public Debt

Each citizen’s share of that debt is around $97,550. If you divide it among taxpayers that share jumps to $253,686.

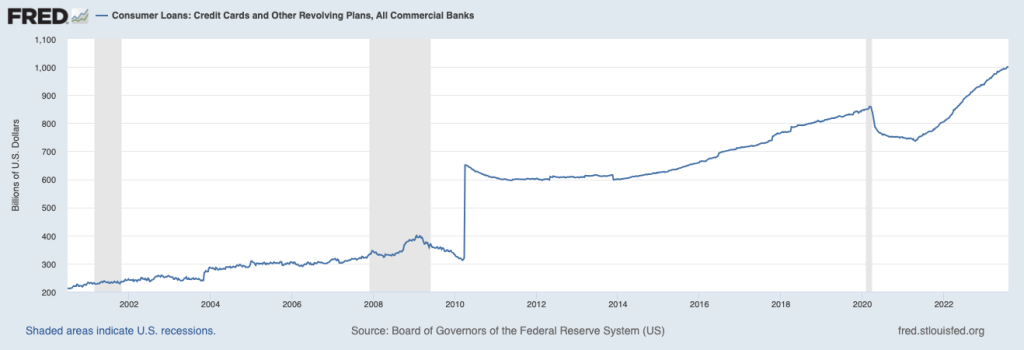
Meanwhile, the credit card debt of American citizens surpassed an inauspicious milestone in Q2, exceeding $1 trillion for the first time ever. Overall household debt rose to $17.06 trillion.

Consumer Loans: Credit Cards and Other Revolving Plans, All Commercial Banks

That’s a monumental debt load no matter how you slice it. Rising interest rates will only make it more difficult for America and Americans to extract themselves from this burdensome situation, especially with student loan payments slated to resume for many in October.

While the Fed has stated its goal is to bring inflation back to the 2% level, there may come a point when a higher rate of inflation becomes desirable to help inflate away the debt. In that situation, the ones that really pay are savers that are capturing a yield lower than the rate of inflation.

One of the best ways to preserve one’s wealth in an inflationary environment is to buy physical gold. In 2021 inflation began to surge due to government spending (see the national debt graph above) and pandemic-related supply chain disruptions.

CPI jumped from 1.7% in February of 2021 to 2.6% in March. At the time gold was trading around $1734. By the time CPI topped out at 9.1% in July of 2022 gold had challenged its record high above $2070. Only drastic action by the Fed prevented new record highs.

During the previous major inflationary period during the 1970s, gold rose from around $35 at the start of the decade to $512 in December of 1979. In January 1980 the yellow metal reached the unheard-of level of $850, a 10-year rise of 2,329%.

Here too only drastic action by legendary Fed chairman Paul Volcker finally tamped inflation and gold. It took a Fed funds rate of 20%.

Setbacks offer buying opportunities for wealth-preservation-minded investors.

Silver

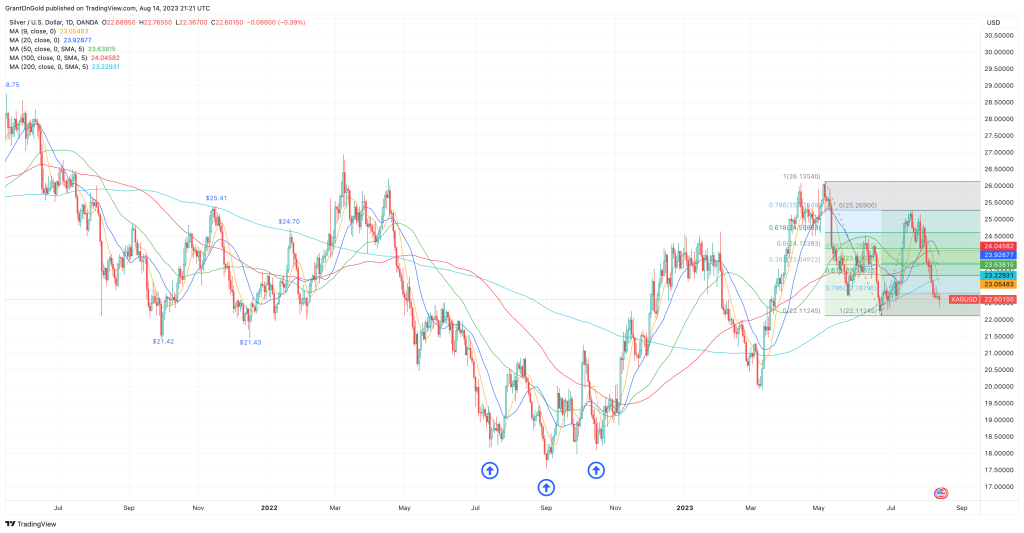
Silver tumbled nearly 4% last week, notching a fourth consecutive lower weekly close. Follow-through losses on Monday saw a 6-week low set at $22.37.

Spot Silver Daily Chart through 8/14/2023

The white metal violated the 50-week, 100-week, and 200-week moving averages on Monday. While the latter was only penetrated slightly and silver firmed into the close, the downside remains vulnerable.

A true challenge of the June low at $22.11 seems likely. If this level gives way, potential would be to the $21.25 Fibonacci level.

Metals like silver that derive the majority of their demand from industry need strong growth from major economies to support prices. Lately, data from China, the world’s second-largest economy, have been rather bleak and the government seems to be reluctant to offer full-fledged stimulus.

PGMs

The PGMs are also being weighed by China’s economic woes.

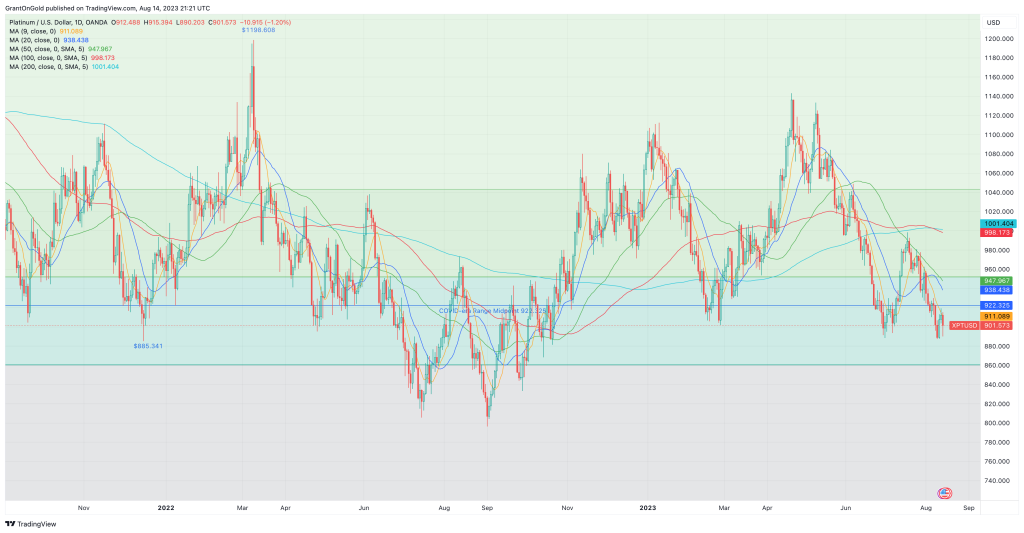
Platinum notched a fourth consecutive lower weekly close last week, reaching a 9-month low at $887.39. The market remains defensive to start the new week.

Spot Platinum Daily Chart through 8/14/2023

Palladium continues to consolidate just above multi-year lows. The downside may be at least temporarily limited by the record net short positioning in the market, but it’s going to be difficult to scare up any buyers given the Chinese growth risks and deflationary pressures.


Non-Reliance and Risk Disclosure: The opinions expressed here are for general information purposes only and should not be construed as trade recommendations, nor a solicitation of an offer to buy or sell any precious metals product. The material presented is based on information that we consider reliable, but we do not represent that it is accurate, complete, and/or up-to-date, and it should not be relied on as such. Opinions expressed are current as of the time of posting and only represent the views of the author and not those of Zaner Metals LLC unless otherwise expressly noted.
Grant on Gold – August 7, 2023
Monday, August 7, 2023

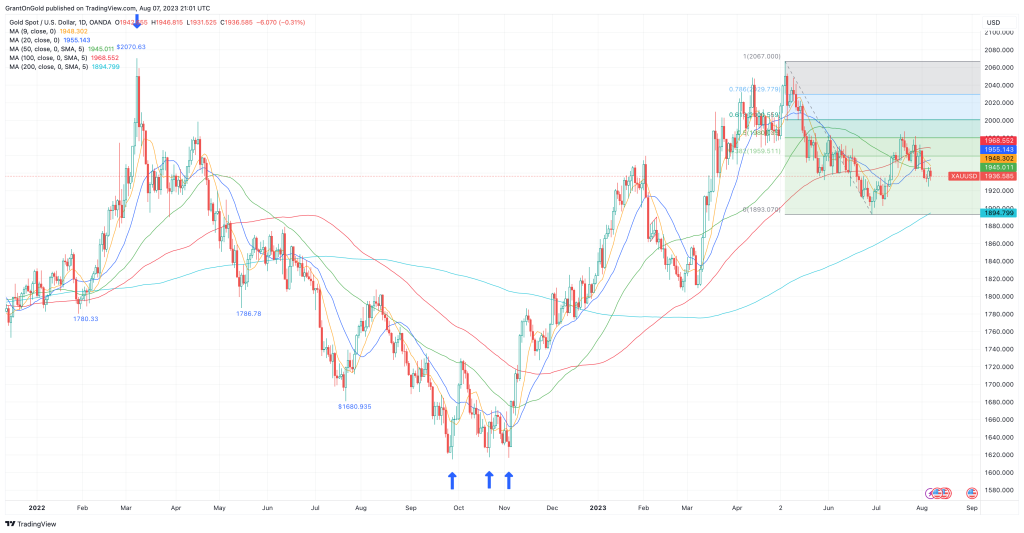
Gold is maintaining a corrective to consolidative tone in the wake of the July FOMC meeting. The market now looks to this week’s inflation data for further confirmation that the Fed is on hold.

Spot Gold Daily Chart through 8/7/2023

July CPI comes on Thursday and median expectations are for a 0.2% monthly increase. PPI is out on Friday and the market is expecting a 0.2% increase here as well.

While decent U.S. economic data suggests there is conceivably room for further monetary tightening, Fed funds futures show an 85% probability that the FOMC will hold steady when they next meet in September. That conviction is not as strong into year-end.

There is heightened optimism in recent weeks that the Fed is going to successfully negotiate a soft landing. It would be quite a feat to avoid recession on the heels of 11 consecutive interest rate hikes over the past 16 months.

The DJIA has rebounded to 16-month highs in recent weeks and is a mere 4% off its all-time high as investors are lured back into stocks. This appetite for risk has weighed on gold with Friday marking the tenth consecutive day of outflows from ETFs, leaving holdings down 2.86 Moz year-to-date.

Is there another shoe to drop in the form of a second wave of inflation and/or a rebound in growth risks? Time will tell, but energy prices are already back on the rise. Crude oil has risen nearly 20% in the past 6-weeks.

Demand from China and India remains subdued, with the former still struggling to recover from COVID-related lockdowns and the latter facing record-high prices against the rupee.

The Indian monsoon season began late this year, but crops have been damaged by more recent torrential rains. A ban on some rice exports from India, meant to ensure domestic availability, is likely to contribute to global food-price inflation while simultaneously putting further pressure on gold demand.

Friday’s price action resulted in a key reversal (lower low, close above the previous session’s high). That’s generally a pretty favorable technical chart pattern, but upside follow-through failed to materialize on Monday. Nonetheless, Friday’s low at 1924.78 now provides a good intervening barrier ahead of the more important $1893.07 support level (29-Jun low).

A breach of initial resistance at $1947 would bode well for renewed tests above the 100-day SMA at $1968.14. I see the July high at $1987.53 as the trigger for a run back above $2000 and an eventual challenge of the all-time high at $2075.28.

However, this bullish scenario threatens to get derailed by weakness in the silver market.

Silver

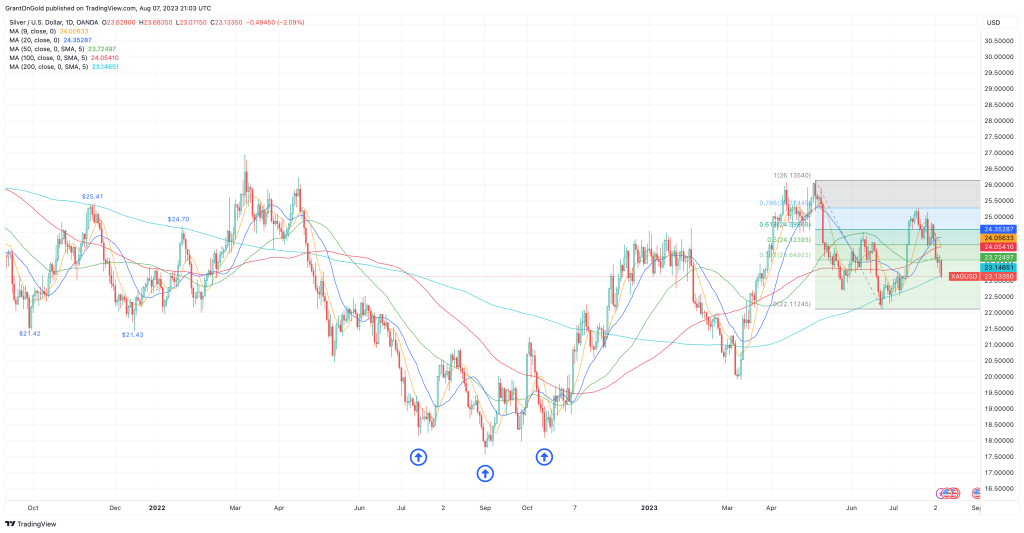
Silver remains on the defensive weighed by ongoing concerns about the Chinese economy. The white metal notched a third consecutive lower weekly close last week and extended 2% lower on Monday.

Spot Silver Daily Chart through 8/7/2023

An ascendant China and its growing middle class have been at the core of every long-term bullish commodity scenario. However, harsh COVID restrictions that didn’t get rolled back until late-2022 sapped investment and consumer spending. Each has been disturbingly slow to recover.

The devastating supply chain issues that were revealed during the pandemic put pressure on international companies to repatriate some key manufacturing, or at least shorten and diversify supply lines. This means China could be facing disinvestment for some time to come.

Stimulus measures have thus far failed to shake free hoarded cash from Chinese businesses and consumers. Both are understandably worried about the level of authoritarian control exerted by Beijing over the past several years and fear that it could easily happen again.

Seems like a good reason to buy some gold.

Heightened political tensions between China and the U.S. further exacerbate the situation.

More than 61.8% of the June/July rally in silver has already been retraced and the 200-day SMA at $23.16 is under pressure. A convincing penetration of this level would shift focus to the 78.6% retracement level at $22.79. Beyond that, the June 23 low at $22.11 would be back in play.

A rebound above $24 is needed to ease short-term pressure on the downside. Such a move would suggest potential back to the July 20 high at $25.27.

PGMs

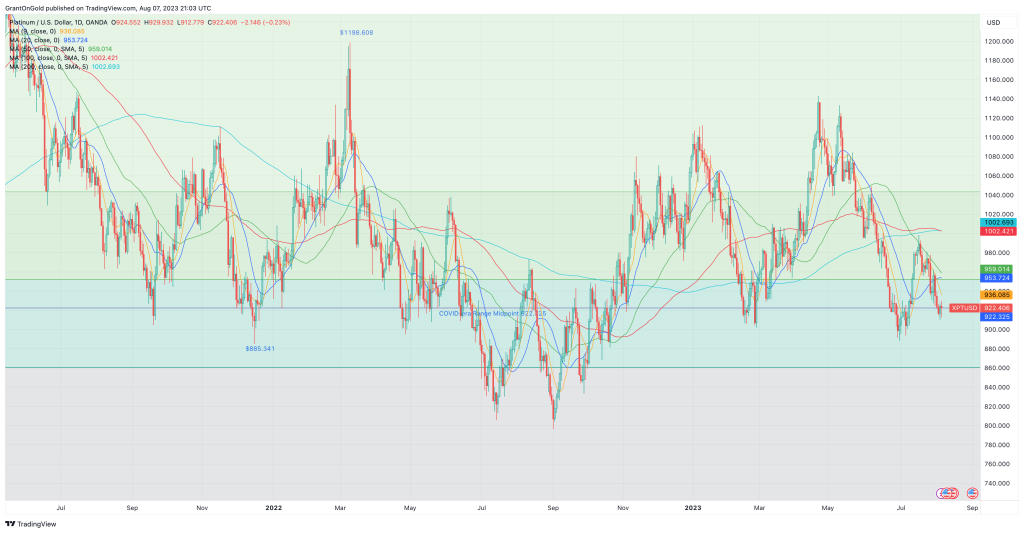
Platinum closed 1.6% lower last week. It was the third consecutive lower weekly close and the weakness extended into Monday’s session.

Spot Platinum Daily Chart through 8/7/2023

The PGMs are also being weighed by the economic situation in China, which is adversely impacting car and truck demand. Heavy monsoon rains and flooding in India have not been good for car and truck demand either.

Palladium is coiling near multi-year lows, but with the market already quite short, a rebound may be needed to attract renewed selling interest.


Non-Reliance and Risk Disclosure: The opinions expressed here are for general information purposes only and should not be construed as trade recommendations, nor a solicitation of an offer to buy or sell any precious metals product. The material presented is based on information that we consider reliable, but we do not represent that it is accurate, complete, and/or up-to-date, and it should not be relied on as such. Opinions expressed are current as of the time of posting and only represent the views of the author and not those of Zaner Metals LLC unless otherwise expressly noted.
Grant on Gold – July 31, 2023
Monday, July 31, 2023

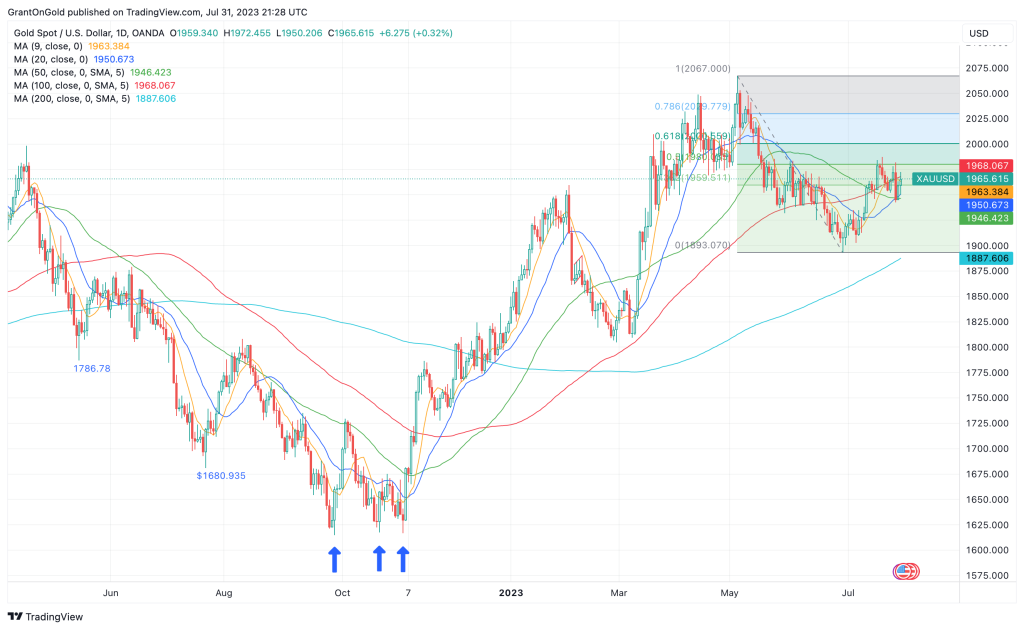
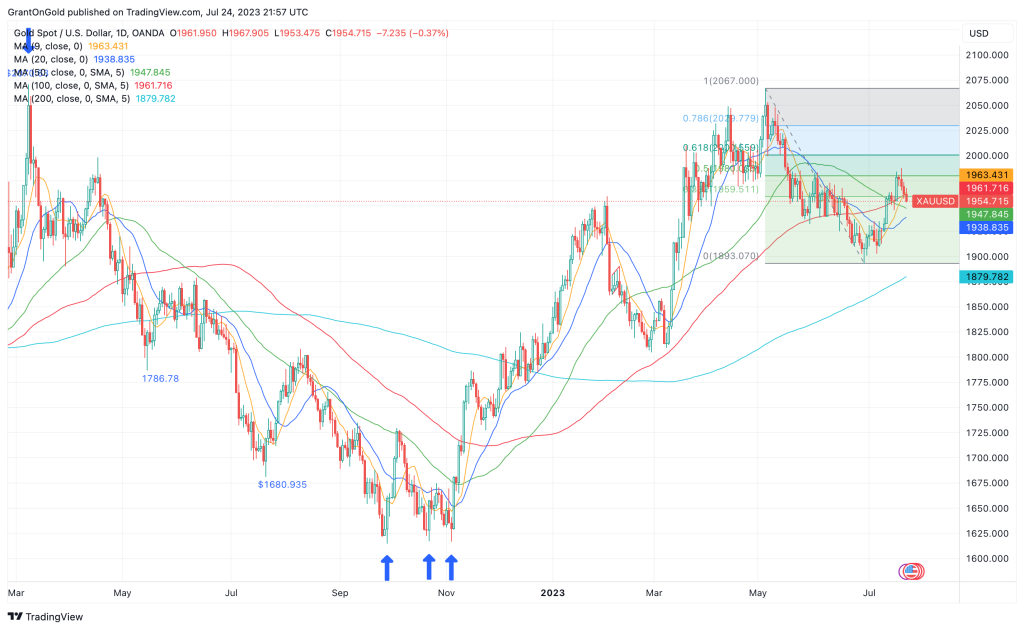
Gold is consolidative just below the midpoint of the May-June range as the market assesses the implications of last week’s Fed rate hike and better-than-expected economic data. The yellow metal ends July with a gain of 2.4%, breaking a 2-month losing streak.

Spot Gold Daily Chart through 7/31/2023

Last week the Fed hiked rates by 25 bps, and it was widely accepted it would be the last one for some time. However, on Thursday Q2 advance GDP came in at 2.4%, above expectations of 1.9%. In addition, durable goods orders surged 4.7% in June, well above market expectations of 1.8%.

These robust data are evidence that the U.S. economy continues to hum along at a respectable pace, despite the marked rise in interest rates over the past 16 months. More hawkish members of the Fed could now conceivably argue there is room for another rate hike. Fed funds futures are currently showing a 20% probability for a 25-bps hike in September.

While the Fed’s favored measure of inflation cooled to 4.1% in June, versus 4.6% in May, there are lingering worries in the market that a second wave of inflation could be in the offing. The national average for a gallon of regular gas jumped 13¢ last week reaching an 8-month high.

I’m often asked why gold didn’t fare better during this inflationary period. The answer lies in the Fed’s aggressive response in raising the Fed funds rate by 525 bps in just over a 1-year period. During that time, gold only corrected 22%, from $2070.63 (just shy of the all-time high) to $1614.92.

Most of those corrective losses have already been retraced, so I would argue that gold held up remarkably well in the face of the most aggressive tightening campaigns in recent history.

The long-term trend remains bullish with the market trading less than $110 off the all-time high. Setbacks into the range are likely to be viewed as buying opportunities.

Silver

Silver closed down more than 1% last week, weighed by persistent concerns that the health of the Chinese economy, and an uptick in the probability of another Fed rate hike in September.

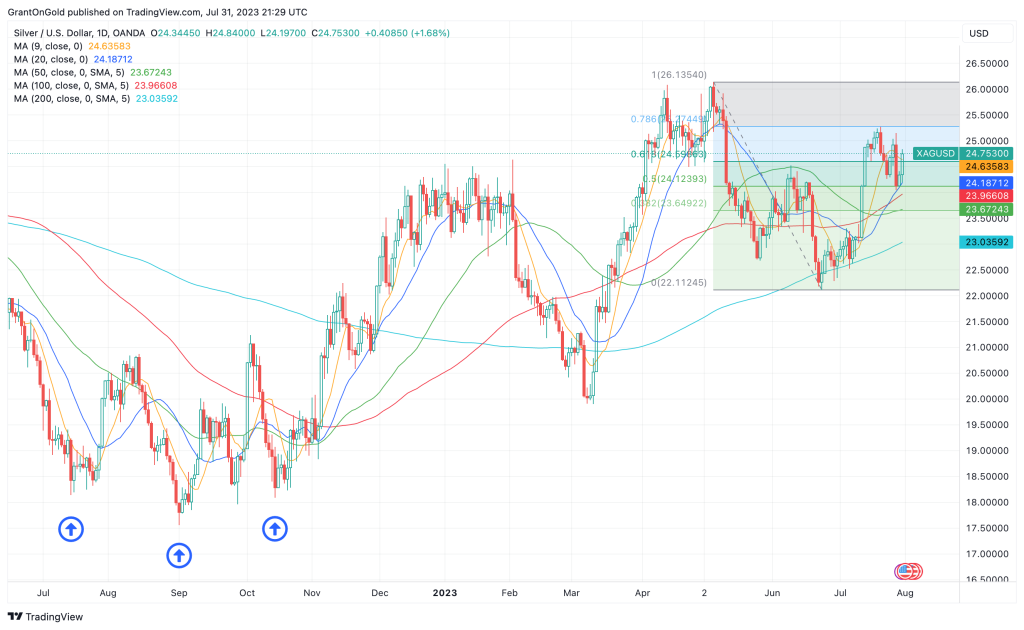
Spot Silver Daily Chart through 7/31/2023

A firmer tone emerged over the past two sessions on the heels of strong U.S. and Japanese data. While the Chinese economy continues to show signs of weakness, the government announced supports for light industry on Friday and then measures to boost consumer spending on Monday.

Such stimulus offers support for both precious and industrial metals. If the Chinese economy continues to struggle, additional (and larger) stimulus would be likely, providing underpinning for the metals.

I like that the 20-day SMA successfully contained the downside last week. Renewed tests above $25 would bode well for a retest of the high from July 20 at $25.27. Penetration of the latter would clear the way for a challenge of the highs for the year at $26.09/14.

PGMs

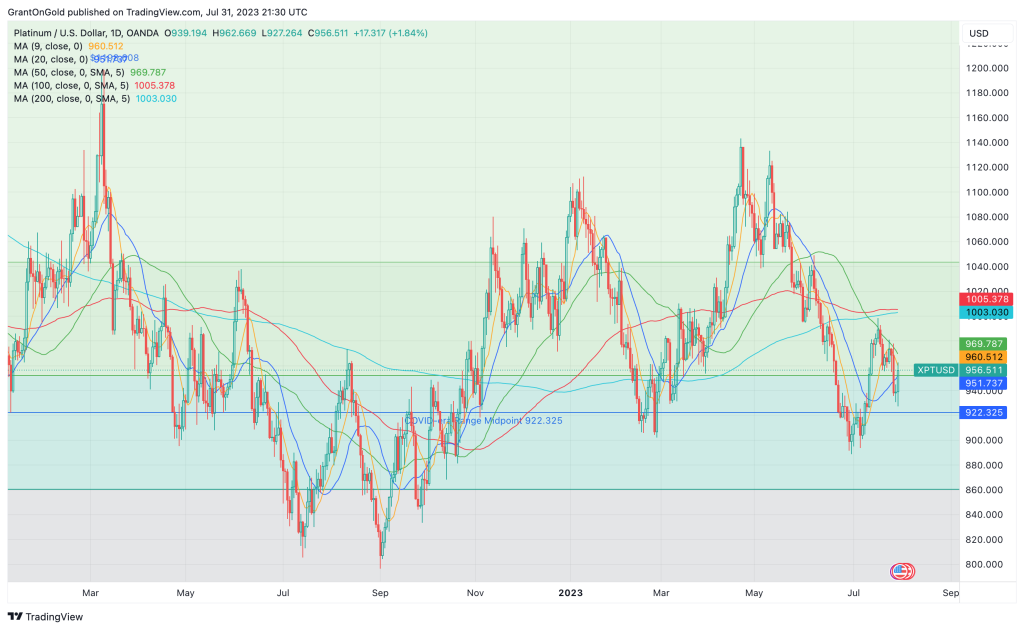
Platinum fell 2.8% last week, notching a second consecutive lower weekly close. A fresh 2-week low was set on Monday before the market snapped back to close nearly 2% higher on the day.

Spot Platinum Daily Chart through 7/31/2023

The outside day with a higher close bodes well for upside follow-through on Tuesday. Strong economic data from the U.S. and Japan, along with Chinese stimulus are supportive factors.

The longer-term supply and demand dynamics remain broadly supportive. Dips into the range are likely to be viewed as buying opportunities.

Palladium has been corrective to consolidative over the past several weeks. While a short-term bottom may be in place at $1185.18, the trend remains bearish.


Non-Reliance and Risk Disclosure: The opinions expressed here are for general information purposes only and should not be construed as trade recommendations, nor a solicitation of an offer to buy or sell any precious metals product. The material presented is based on information that we consider reliable, but we do not represent that it is accurate, complete, and/or up-to-date, and it should not be relied on as such. Opinions expressed are current as of the time of posting and only represent the views of the author and not those of Zaner Metals LLC unless otherwise expressly noted.
Grant on Gold – July 24, 2023
Monday, July 24, 2023

Gold’s focus this week is squarely on the FOMC meeting. The two-day meeting begins on Tuesday with the policy announcement and Chairman Powell’s press conference set for Wednesday.

Spot Gold Daily Chart through 7/24/2023

 In the eyes of the market, a 25-bps rate hike is a foregone conclusion. Fed funds futures reflect a probability of 98.3%. That is largely the result of the ongoing tempering of U.S. inflation data.

June CPI data showed a full-point drop in annualized consumer inflation to 3.0% from 4.0% in May. June PPI fell to 0.1% y/y, versus a downward revised 0.9% y/y in May.

The market is widely anticipating that Fed will pause after this week’s hike. The target rate is then most likely to remain at 5.25% – 5.5% into Q1-2024. However, the policy statement will undoubtedly state that the rate path will be data-dependent.

What comes next though? Arguably growth risks remain in light of the rather dramatic series of rate hikes over the past 16 months. On the other hand, Vincent Deluard of StoneX believes we “should brace for second and third inflationary waves, as was the case in the 50s and 70s.”

The yellow metal set a 9-week high last week shy of the $2000 level, buoyed by a weaker dollar. The dollar index tumbled to a 15-month low on the belief that the Fed is on the verge of pausing, while other major central banks will continue their tightening campaigns.

While gold and the dollar have adopted corrective tones in more recent sessions, I see this as primarily associated with position squaring ahead of the Fed decision. If the policy statement is in line with expectations ­– without an over-the-top emphasis on data dependency – the dominant trends should resume.

Silver

Silver closed down 1.3% last week. It was the first lower weekly close in four.

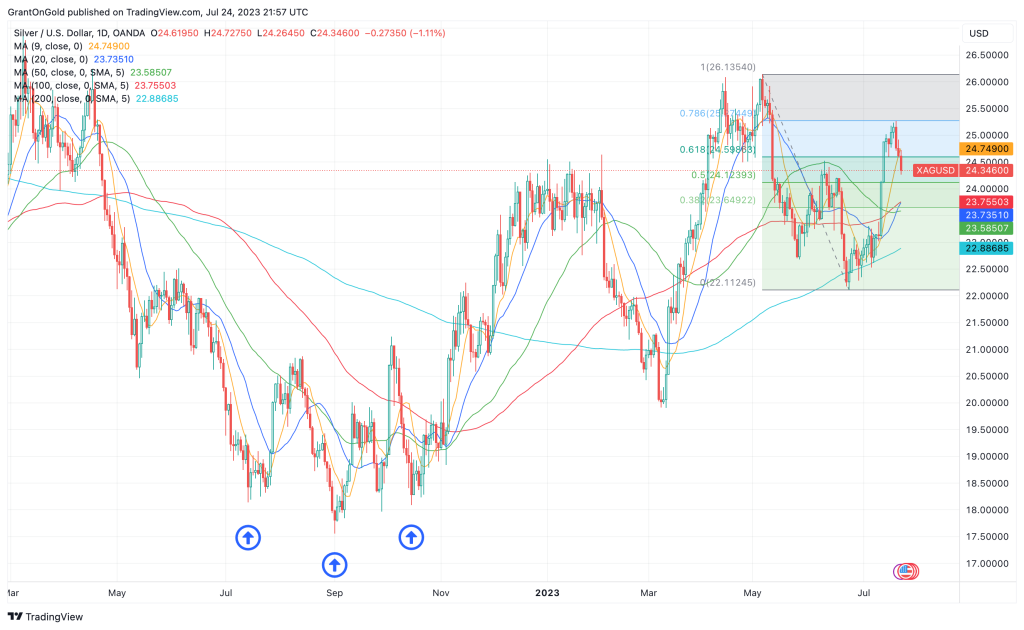
Spot Silver Daily Chart through 7/24/2023

A key reversal did form on Thursday last week, so it was not surprising to see downside follow-through late last week and into Monday. Here too, we suspect some profit-taking ahead of the FOMC meeting.

Heightened growth risks may be putting some pressure on the more industrial metals as well. Preliminary US manufacturing PMI for July came in better than expected at 49, but the indicator appears on track for a third consecutive month of contraction.

Meanwhile, services PMI slumped to 52.4, well below expectations of 54. It was the sixth straight month of expansion, but the slowest pace since March.

According to the report: “The overall rate of output growth, measured across manufacturing and services, is consistent with GDP expanding at an annualized quarterly rate of approximately 1.5% at the start of the third quarter. That’s down from a 2% pace signaled by the survey in the second quarter.”

While economic growth slowed in July, there are plenty clinging to the notion of a soft landing. Let’s just say that my confidence in the Fed’s ability to orchestrate such an outcome is not particularly high.

I’m also somewhat concerned about the ongoing lack of investor interest, despite the (near-perfect) 78.6% retracement of the May-June decline. ETF outflows last week totaled 6.4Moz, leaving net holdings down more than 2% YTD.

The longer-term supply/demand fundamentals remain broadly favorable, and setbacks are likely to be viewed as buying opportunities.

PGMs

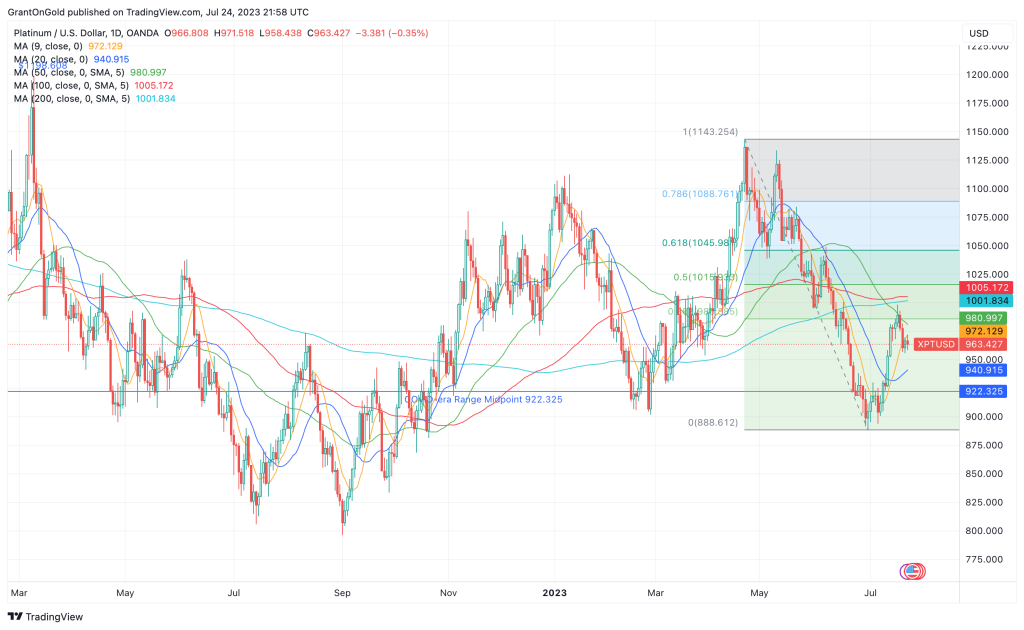
Platinum fell 1.1% last week but not before establishing a 5-week high at $998.43. The inability of the market to regain $1000 leaves the upside limited while the market awaits the Fed’s decision.

Spot Platinum Daily Chart through 7/24/2023

Consolidative range trading persists. A rebound above $1000 would set a more favorable tone within the $564.70/$1339.35 range.

Palladium remains defensive near 4½-year lows.


Non-Reliance and Risk Disclosure: The opinions expressed here are for general information purposes only and should not be construed as trade recommendations, nor a solicitation of an offer to buy or sell any precious metals product. The material presented is based on information that we consider reliable, but we do not represent that it is accurate, complete, and/or up-to-date, and it should not be relied on as such. Opinions expressed are current as of the time of posting and only represent the views of the author and not those of Zaner Metals LLC unless otherwise expressly noted.
Grant on Gold – June 5, 2023
Monday, June 5, 2023

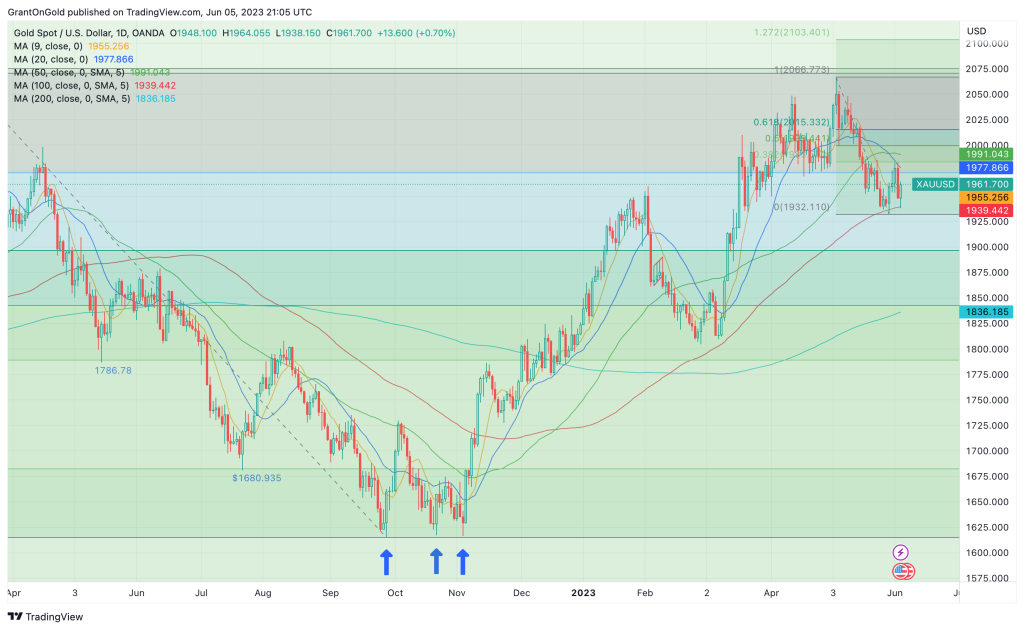
Gold remains defensive below the $2000 level as ongoing strength in the labor market keeps the threat of inflation highlighted. That in turn makes it difficult to rule out further rate hikes.

Spot Gold Daily Chart through 6/5/2023

U.S. nonfarm payrolls for May came in at a solid +339k, well above market expectations of +193k, versus a positively revised +294k in April. While the unemployment rate rose to 3.7%, strength in the payrolls numbers diminishes the likelihood that a recession is impending.

This also seems to provide some additional leeway for the Fed to further tamp inflation with another rate hike this month, although that’s not really being reflected in Fed funds futures yet. The CME’s FedWatch tool puts the probability of a 25-bps rate hike at 24.1% as of Monday.

The resolution of the latest debt-ceiling standoff has taken some of the haven bid out of gold. While default has been averted, there doesn’t seem to be any palpable sense of relief.

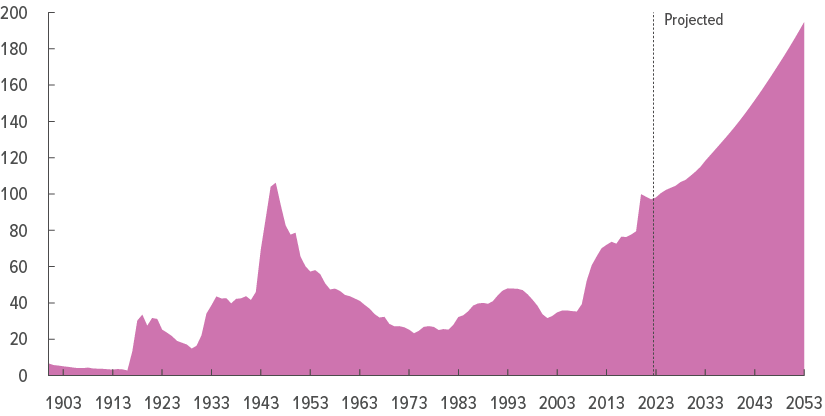
The debt ceiling has been suspended until January 2025, allowing Treasury to borrow as much as it wants until the debt ceiling is reinstated. The CBO projects total debt held by the public to grow to $27.4 trillion by the end of 2024 and exceed 100% of GDP. Gross debt is expected to be north of $34 trillion.

Federal Debt Held by the Public, 1900 to 2053

By the end of 2033, total debt held by the public is projected to rise to $46.4 trillion, and 118.2% of GDP. Gross debt at the end of 2033 will be approaching $52 trillion.

Those numbers and that chart – especially the trajectory – are reasons for considerable concern. The debt and the servicing costs are an ever-growing millstone around the neck of economic growth potential.

While this is certainly a grim reality for the U.S., the explosion of debt is a global phenomenon.

A recent report by the consultancy group McKinsey found that since 2000, “Globally, for every $1.00 of net investment, $1.90 of additional debt was created.” This was largely due to rising debt levels and quantitative easing (money printing). During 2020 and 2021, “The creation of new debt accelerated to $3.40 for each $1.00 in net investment.”

That’s pretty staggering. Not surprisingly, investors are wondering where they can turn to safeguard their wealth. A recent Bloomberg survey showed that 52% of professional investors and 46% of retail investors picked gold as their top safety choice. Treasuries were a distant second at 14% and 15% respectively.

According to a Gallup poll gold has vaulted into second place for the best long-term investment, behind real estate. According to the poll, gold is now comfortably favored above stocks/mutual funds, Savings accounts/CDs, and bonds.

It’s worth recalling that the world’s central banks have been buying gold voraciously. Central Bank gold buying reached a record 1,078 tonnes in 2022. This year is off to a strong start as well, with Q1 demand hitting a record 228 tonnes, 34% higher than the previous Q1 record set in 2013.

While much has been said in recent weeks about gold weakness stemming from a stronger dollar, keep in mind that the yellow metal is only about $100 (less than 6%) off its all-time high of $2075.28. Savvy investors will likely view short-term setbacks as buying opportunities.

Silver

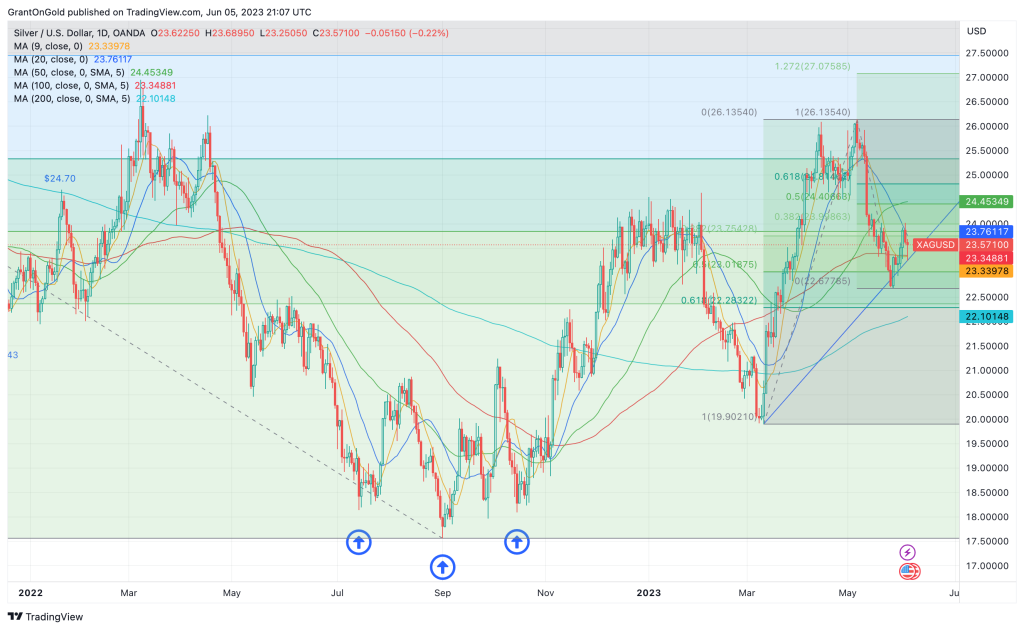
Silver ended May with a loss of 6%. It was the first lower monthly close in three, as uncertainty over the debt ceiling and growth risks worried investors.

Spot Silver Daily Chart through 6/5/2023

Resolution of the debt ceiling crisis – or perhaps more accurately forestalling of the real crisis – along with optimistic economic data may help put a floor under silver. Supply and demand fundamentals remain broadly supportive, but investors remain reticent.

Silver ETF saw outflows of 2.5 Moz last week. Holdings declined by 838 koz on Friday alone, even after the impressive NFP beat.

Additional retracement of the recent losses is needed to re-instill a measure of confidence in the scenario that calls for an eventual retest of the $30 zone. A rise back above $24.50 might spark some interest among those investors.

What those investors should really be looking at are the realities of incredibly strong demand in just about every sector of the physical silver market. At the same time, the market is in deficit and is projected to remain in deficit for the next five years.

That bodes well for the longer-term outlook which should carry silver to new record highs. It’s a pretty compelling story for investors, but they just aren’t paying attention at this point.

PGMs

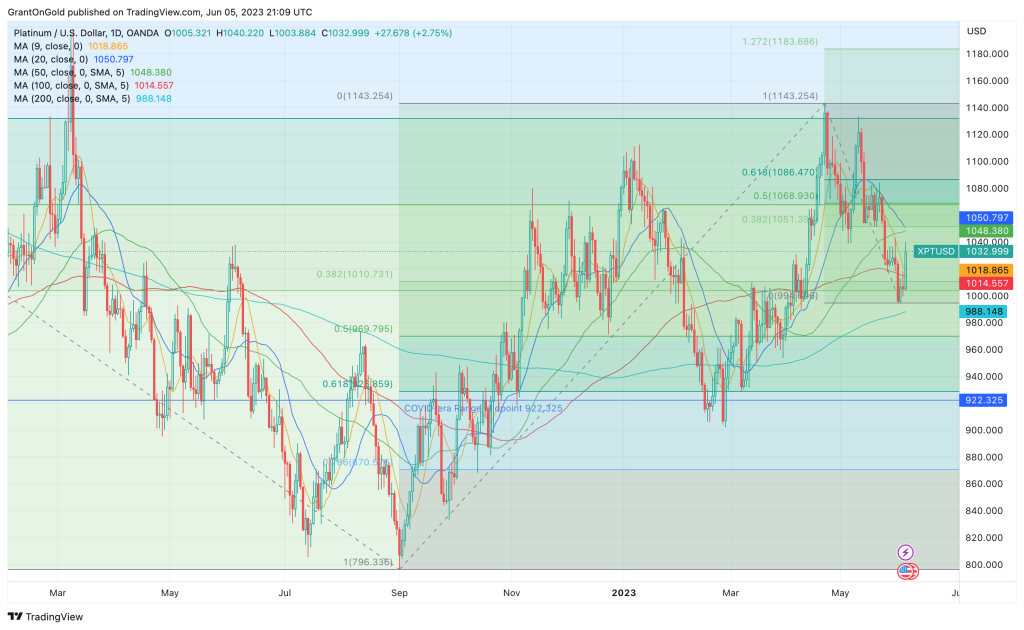
Platinum is maintaining a corrective stance, although Monday’s rebound offers some encouragement. The industrial metals didn’t like the strong nonfarm payrolls number on Friday as it heightened the possibility of further Fed rate hikes.

Spot Platinum Daily Chart through 6/5/2023

While total vehicle sales dipped in May to 15.6M from 16.6M in April, the general trend seems to suggest the potential for a return to the pre-pandemic level of around 17.5M units.

I remain cautiously bullish on platinum. If the U.S. can avert a recession, as suggested by persistently strong incoming data, scope is seen for a near-term retest of $1200.

Palladium continues to bounce along the bottom, within striking distance of the 4-year low at $1329.18.


Non-Reliance and Risk Disclosure: The opinions expressed here are for general information purposes only and should not be construed as trade recommendations, nor a solicitation of an offer to buy or sell any precious metals product. The material presented is based on information that we consider reliable, but we do not represent that it is accurate, complete, and/or up-to-date, and it should not be relied on as such. Opinions expressed are current as of the time of posting and only represent the views of the author and not those of Zaner Metals LLC unless otherwise expressly noted.